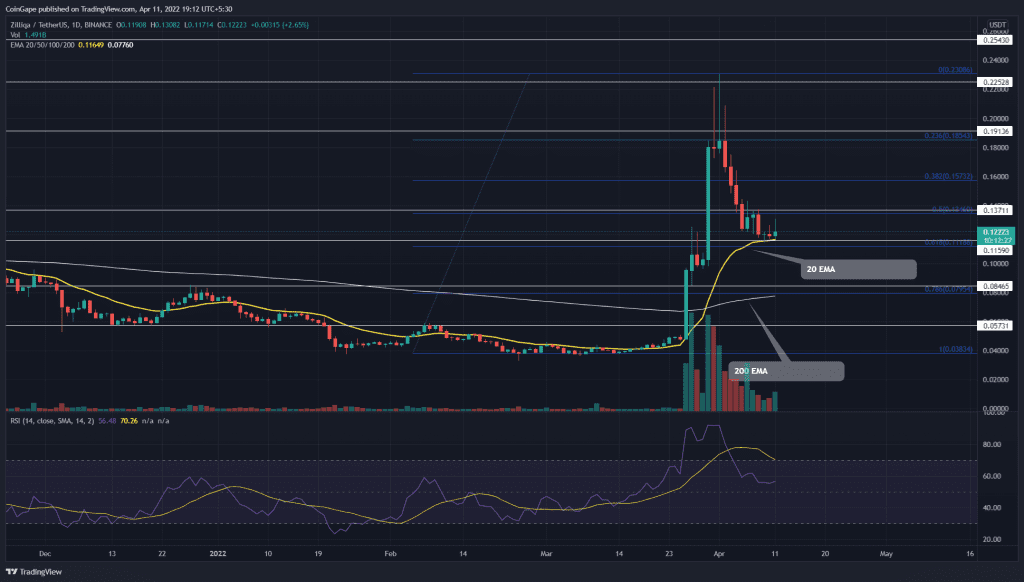
The Zilliqa(ZIL) price coils up after a freefall to the $0.122 support. The coin price tags a confluence of major technical supports at this level, mounting a solid foothold for buyers. Can the renewed bullish momentum overcome the ongoing correction rally?
Key points
- The ZIL price drop to the 0.618 Fibonacci retracement level
- The 100-day EMA is poised to cross above the 200-day EMA
- The intraday trading volume in the Zilliqa coin is $127.5 Billion, indicating a 138% gain.
Source- Tradingview
The ZIL/USDT pair witnessed a perpendicular rally in late March, which raised the altcoin price to the $0.23 mark. In less than three weeks, the ZIL price registered a 524% ROI from the $0.37 support.
However, the technical chart showed several high price rejection candles near $0.22 resistance, suggesting the buyer got exhausted from the sudden price jump. Following this rejection, the altcoin experienced a correction rally to $0.116.
The ZIL price tumbled by 49.7% as it reached shared support of 0.618 FIB level and 20-day EMA. The cluster of technical supports at the $0.116 mark could stall the ongoing correction rally and tease a bullish reversal.
However, a sudden reversal is not expected, and the price might consolidate above the $0.166 support before continuing the bullish rally.
Technical indicator
The Relative Strength Index(54) slope reverted from the overhead region and dropped beneath the 14-SMA line. However, the indicator value above the 50% mark suggests the market sentiment remains bullish.
The 20-day EMA aligned with the $0.116 support reinforced buyers to continue the bullish rally. Moreover, the 100-and-200-day EMA approaching a bullish crossover would give an additional push.
- Resistance levels- $0.137, and $0.153
- Support levels are $0.116 and $0.084


