Alpha Finance (ALPHA) is making yet another attempt at moving above a horizontal resistance area, which if successful, would greatly accelerate the rate of increase.
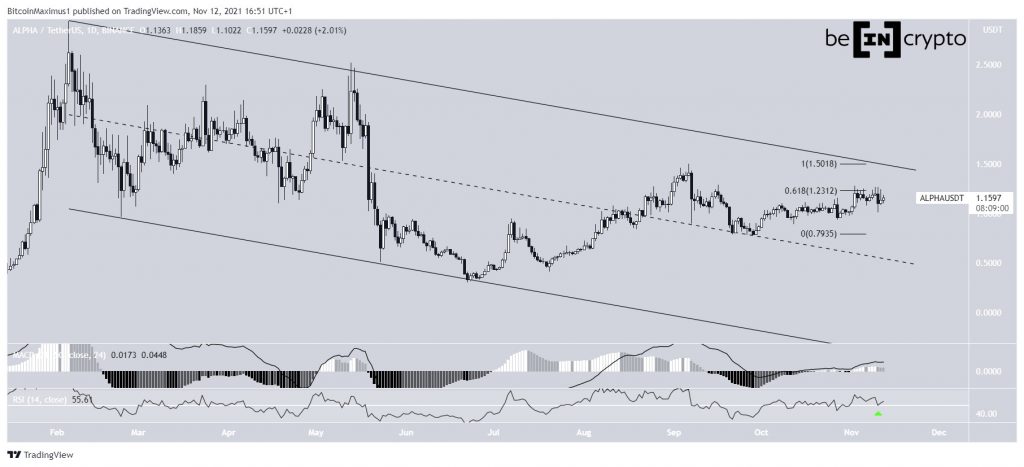
ALPHA has been decreasing inside a descending parallel channel since Feb 6, when it reached an all-time high price of $2.94. Such channels usually contain corrective movements. Therefore, an eventual breakout from the channel would be likely. This possibility is supported by the fact that the price is trading in the upper portion of this channel.
Technical indicators are bullish. The RSI, which is a momentum indicator, has just bounced above the 50 line.
The MACD, which is created by a short- and a long-term moving average (MA), is positive. However, it seems to have stopped moving upwards, which can be seen as a sign of weakness.
ALPHA is currently facing resistance at $1.23. This is the 0.618 Fib retracement level of the previous downward movement. If it manages to move above it, it would likely increase at an accelerated rate.

Short-term breakout
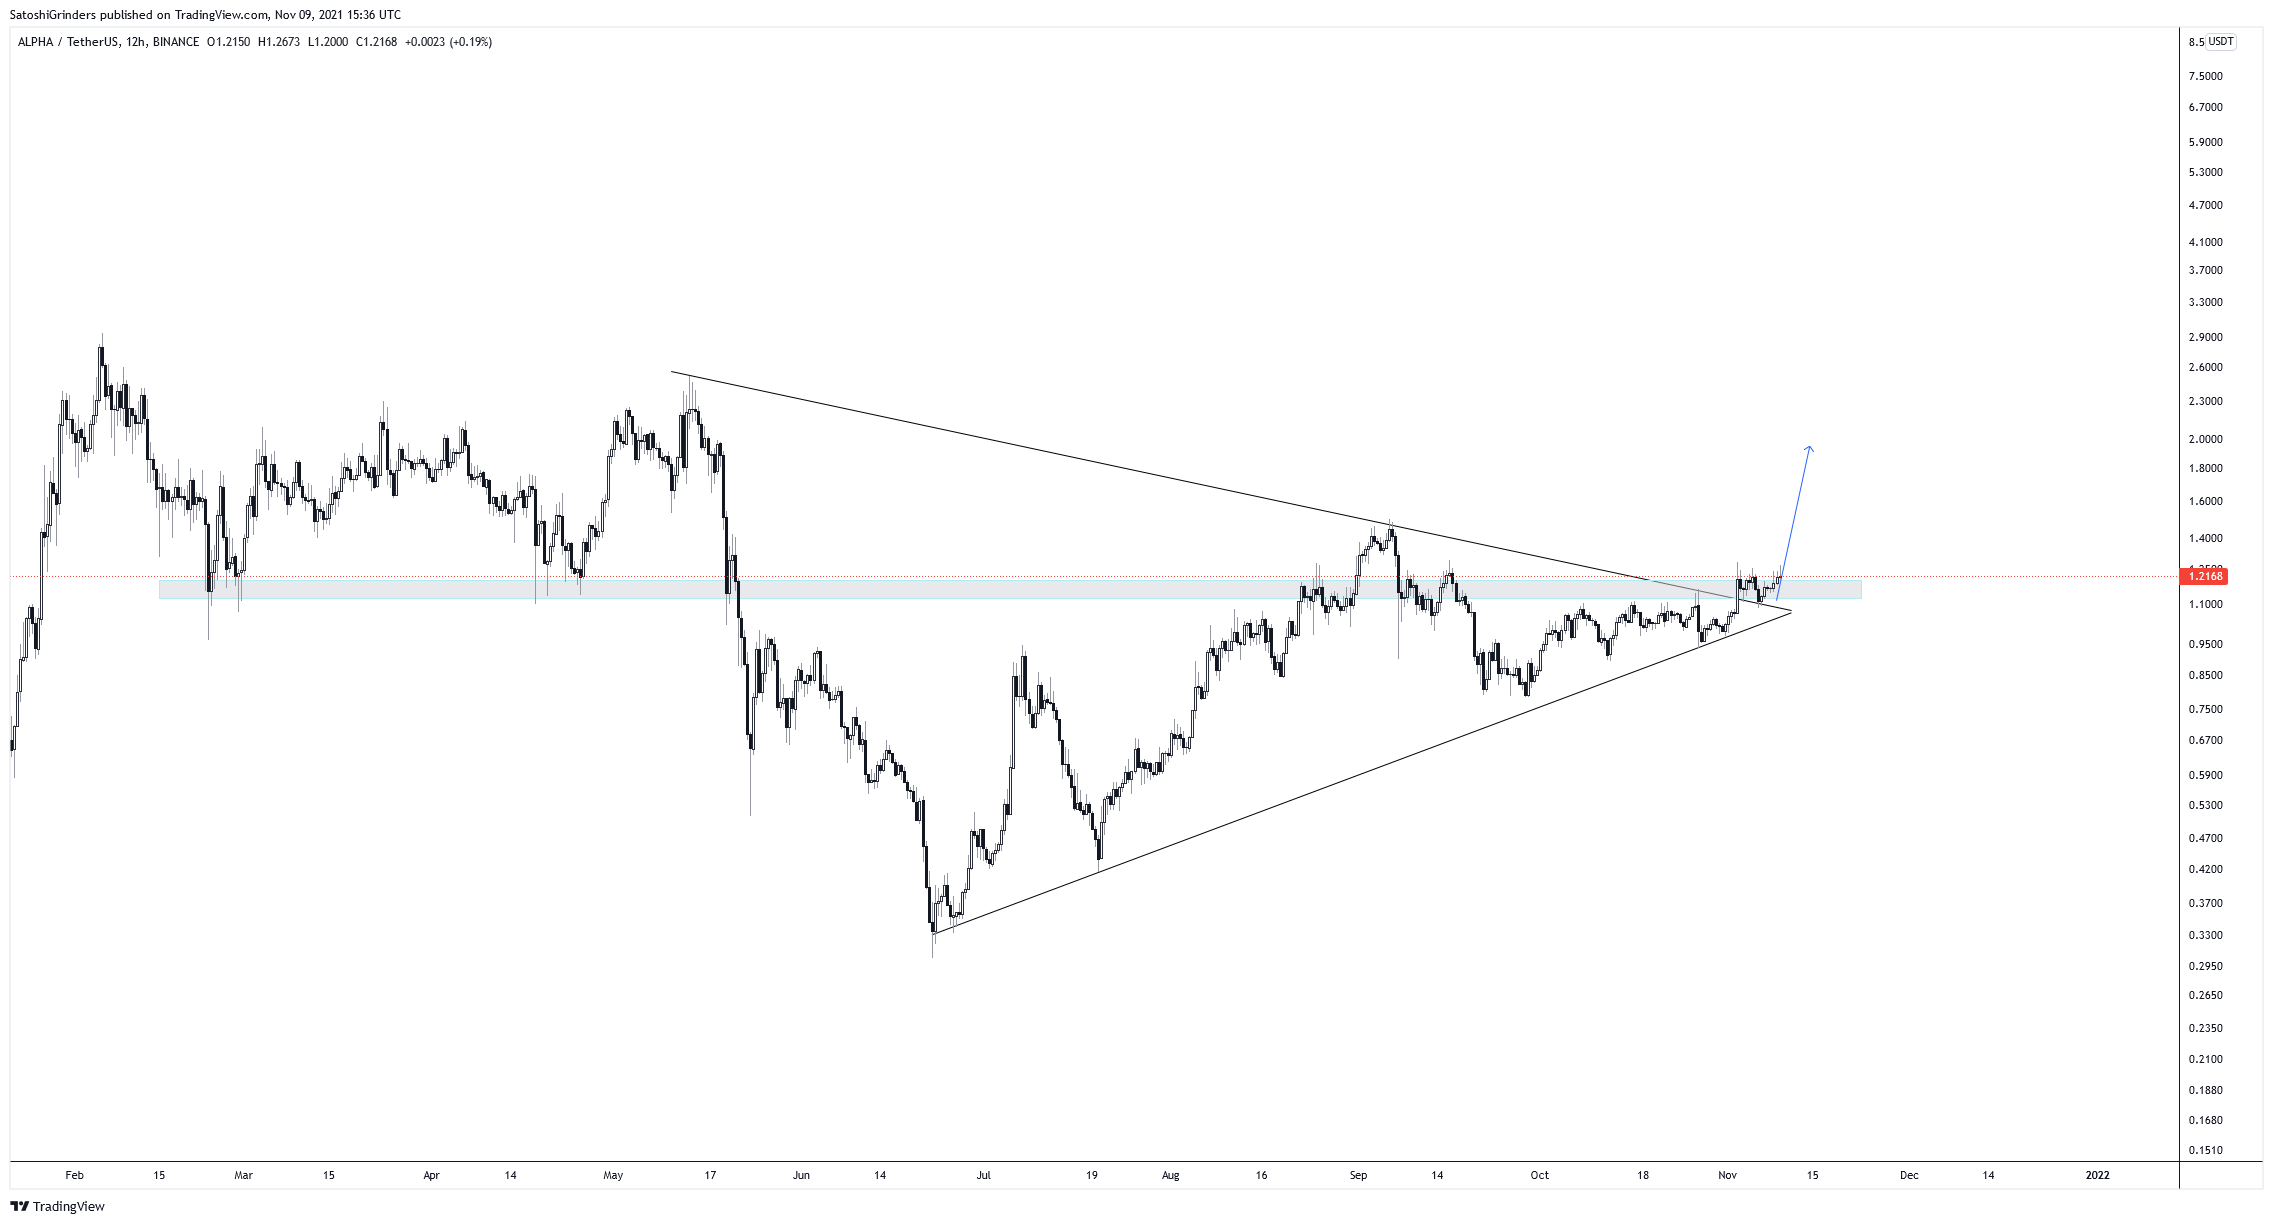
Cryptocurrency trader @thebull_Crypto outlined an ALPHA chart, stating that the token is in the process of breaking out from a long-term horizontal resistance area at $1.21.

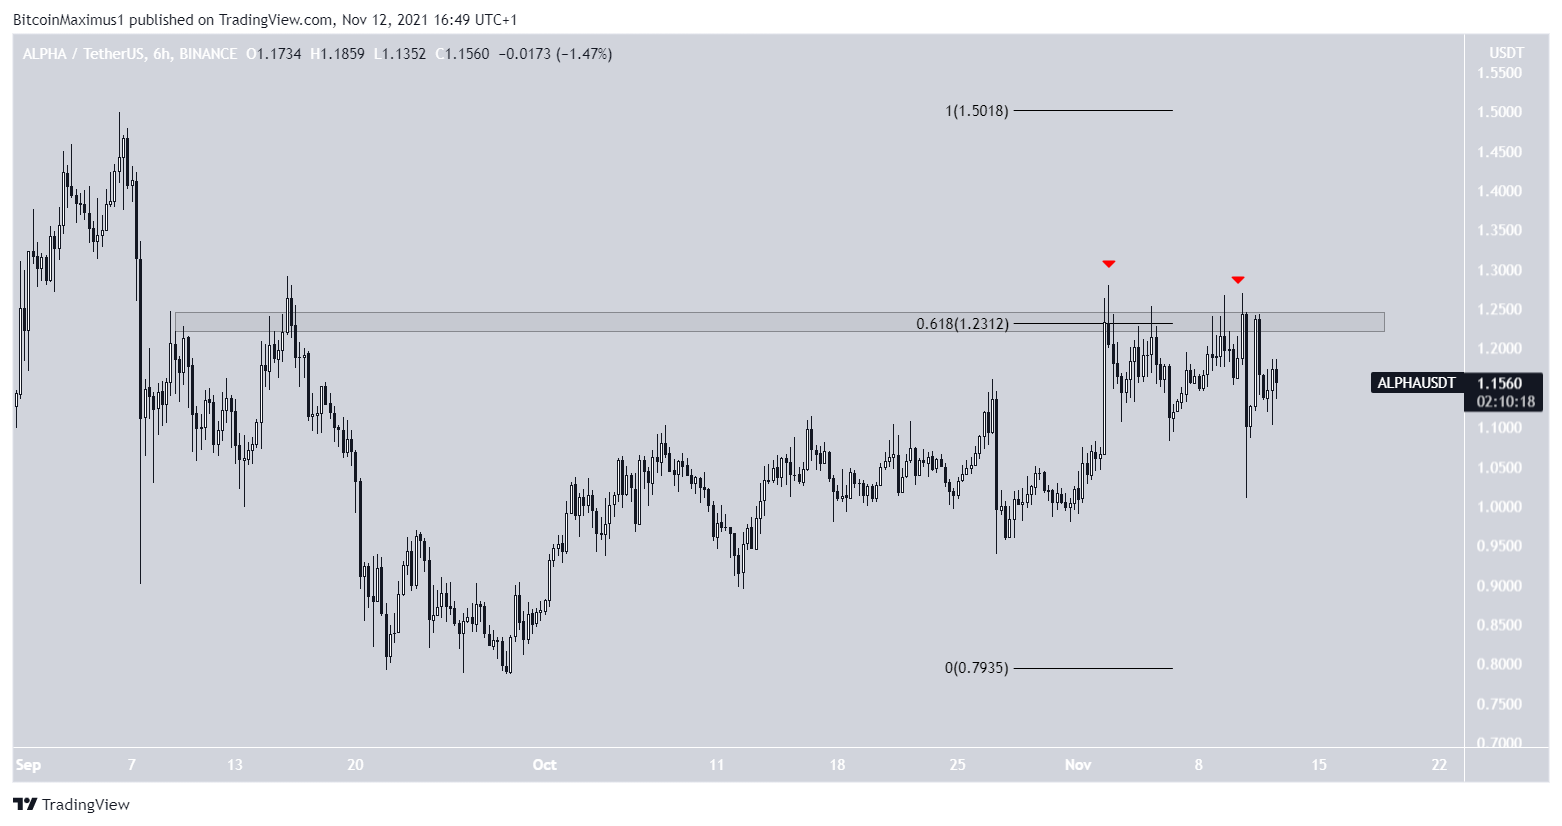
Since the tweet, ALPHA has made several short-term attempts at moving above this area (red icons). However, they have been unsuccessful.
Besides being a horizontal resistance, the $1.23 area is also the 0.618 Fib retracement resistance level. Therefore, a breakout above it would likely greatly accelerate the rate of increase.

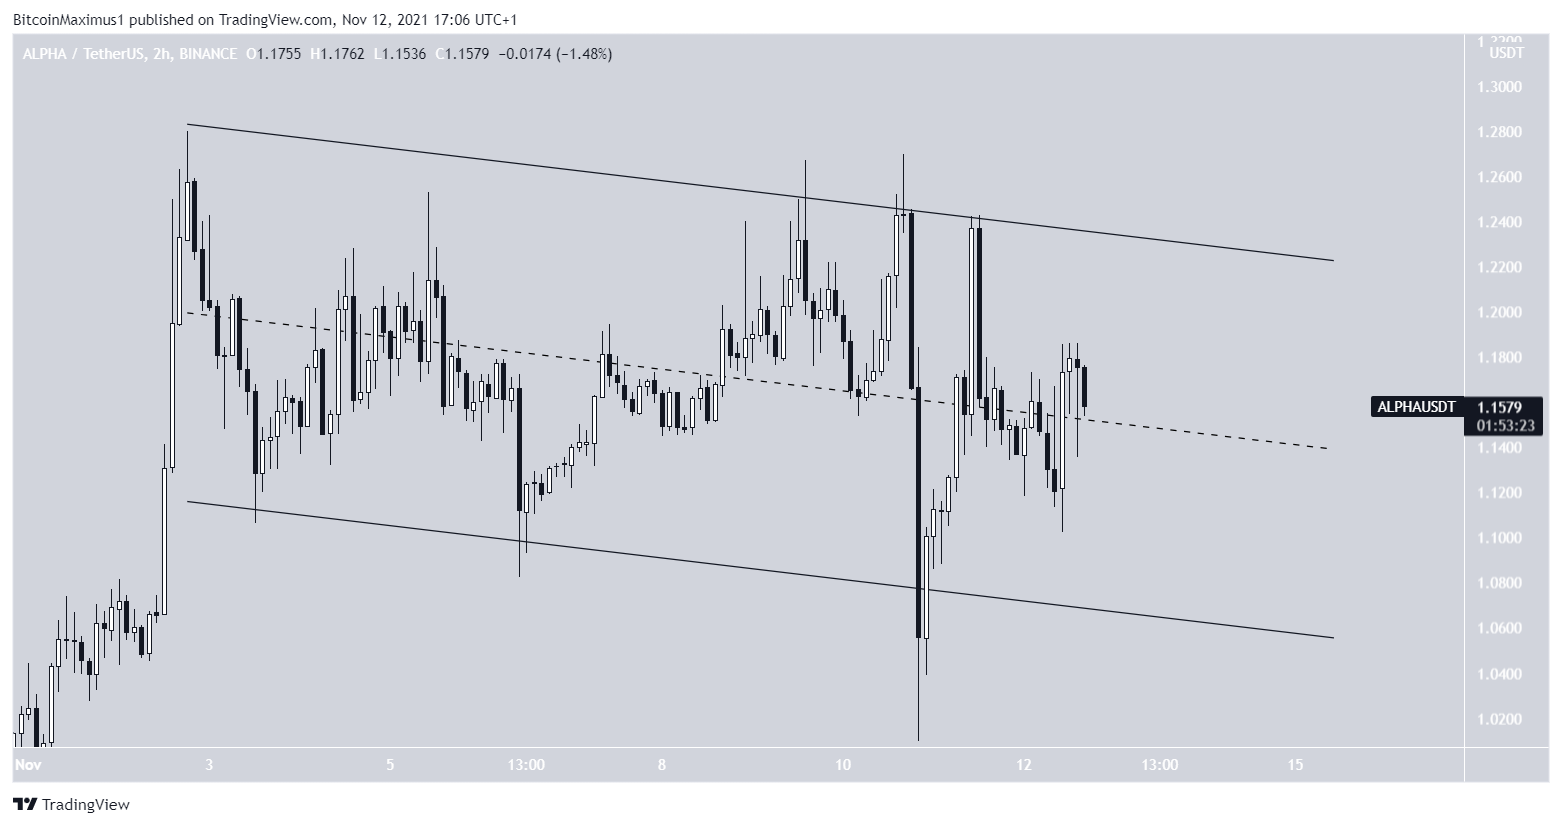
A look at the even shorter-term two-hour chart shows another descending parallel channel. Similarly to the daily time-frame, a breakout from this one would also be the most likely movement.
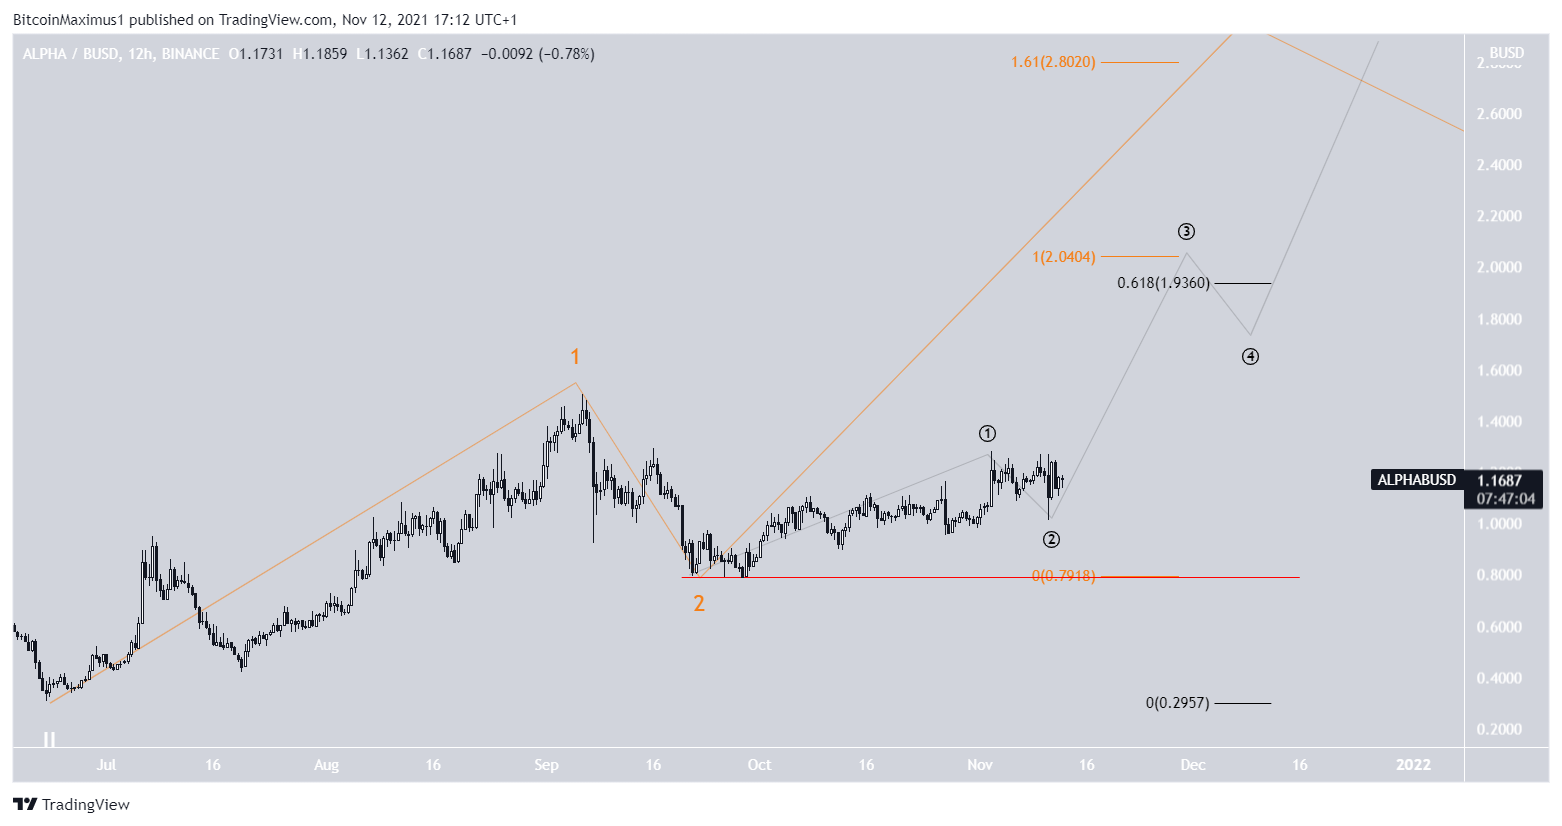
ALPHA wave count
The wave count suggests that ALPHA could in the beginning of wave three (orange) of a five wave upward movement. The sub-wave count is provided in black.
If the count is correct, the first resistance area would be between $1.94-$2.04. It is found using the 0.618 Fib retracement resistance level from the all-time high and would give waves 1:3 a 1:1 ratio.
A decrease below the Sept 21 low of $0.79 (red line) would invalidate this particular wave count.
For BeInCrypto’s latest Bitcoin (BTC) analysis, click here.
What do you think about this subject? Write to us and tell us!
Disclaimer
All the information contained on our website is published in good faith and for general information purposes only. Any action the reader takes upon the information found on our website is strictly at their own risk.