XRP price forms a descending triangle pattern, hinting at 13% correction towards $1.03. The sell signal from the MACD and the position of the 100 and 50 SMAs above the Ripple price show that recovery faces significant resistance upwards.
Ripple (XRP) continues with its sideways price action following the November 10 drop that saw the XRP price tank 13.28% from highs of about $1.34 to lows of about $1.034. This drop makes the thickest part of the descending triangle chart pattern that the Ripple price has formed on the two-hour chart. There have been several recovery attempts but no significant progress has been made to push XRP towards the November 10 high.
XRP Price Prepares For A 13% Drop To $1.03
At the time of writing, XRP is hovering around $1.1851 and appears to have formed a descending triangle chart pattern on the two-hour chart. Bulls are currently dealing with overhead pressure from the 50-period Simple Moving Average (SMA) at $1.1920. Holding above the 200 SMA at $1.1804 has become very crucial for the resumption of the upward movement. However, the overall technical picture shows that Ripple may drop further in the near term.
The chart pattern will be validated if XRP price breaks below the X-axis provided by the horizontal trendline of then governing chart pattern. The breakout should occur before the trend lines converge and has a target equal to the distance between the triangle’s thickest point as earlier explained.
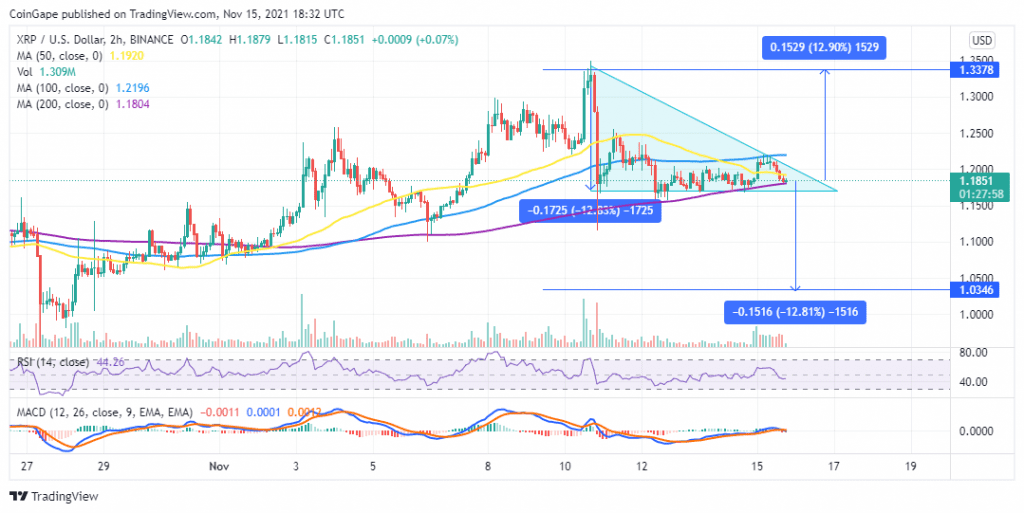
This means that a breakout below the triangle could see Ripple lose as much as 13% to tag the $1.0346 level as shown on the two-hour chart.
XRP/USD Two-Hour Chart

The bearish outlook is accentuated by the down-sloping Relative Strength Index (RSI) indicator and its position around 41.10 suggest that the bears are currently stronger than the bulls.
Moreover, the position of the Moving Average Convergence Divergence (MACD) indicator below the signal line validate XRP’s bearish narrative. Also note thee MACD just sent a sell signal on the two-hour chart. This occurred in the previous two-hour trading session when the 12-period Exponential Moving Average (EMA) crossed below the 26 EMA signaling a bearish Ripple.
Looking Over The Fence
XRP price bearish outlook will be invalidated if support at by the 200 SMA at $1.1804 holds and Ripple flips the 50 SMA at $1.1920 into support. If this happens, XRP bulls will kick-start the uptrend that is likely to see the price slice through the triangle’s descending trendline at $1.2045 confirming a bullish breakout.