The Metaverse token has obtained a special place in crypto inventors’ hearts since the major rebranding of Facebook to ‘Meta.’ Reacting to this massive news, the majority of Meta tokens experience a flood of investors who wanted to be a part of this promising technology. Check out the price analysis of SAND, MANA, and AXS tokens.
SAND/USD Chart In The 4-hour Time Frame

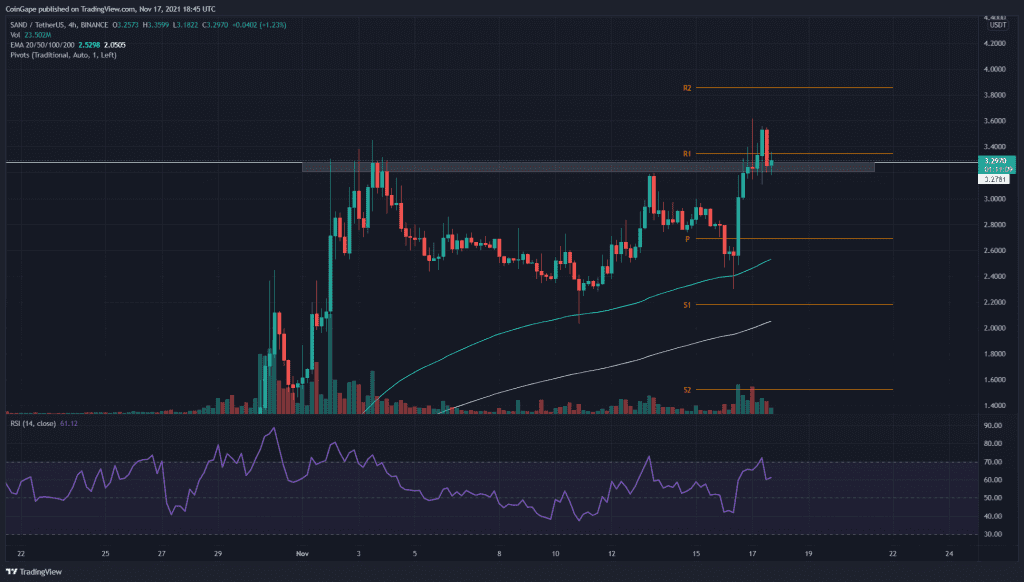
Source- SAND/USD chart by Tradingview
On November 3rd, the SAND token rally made a New All-Time High of $3.45 before initiating a minor retracement phase. Trying to recover from this pullback, the token price rechallenged the overhead resistance only to face another strong rejection.
However, the SAND token has again gained the interest of the crypto investors due to its recent announcement of Sandbox Alpha to be launched on November 29th. The technical chart showed the impact of this news with a 17% gain in the November 16th intraday session.
The token price managed to break out from the previous ATH of the $3.3 mark, indicating an excellent long opportunity for crypto traders. The token is currently in a retest phase which should validate if this breakout was genuine or not.
Furthermore, the Relative Strength Index(74) shows a strong bullish sentiment regarding the token price. However, the RSI chart also shows a bearish divergence, and therefore, the crypto should be cautious enough to accept the possibility of a fakeout.
MANA/USD Chart In The 4-hour Time Frame

Source- MANA/USD chart by Tradingview
The MANA/USD chart shows a reasonable possibility of forming a Cup and Handle pattern in the 4-hour time frame chart. The neckline for this pattern is at the $3.68 mark, and the price still needs to complete its handle portion.
Once the price gives a proper breakout from the overhead resistance, the crypto traders can grab a great long opportunity for them. In addition, the 100 EMA line act as great support for the minor pullbacks in this chart.
Furthermore, the Relative Strength Index(49) indicates a slight bearish, neutral sentiment for this token. Moreover, the evident bearish divergence in the RSI chart brings a big concern for the MANA token.
AXS/USD Chart In The 4-hour Time Frame

Source- AXS/USD chart by Tradingview
The AXS token has displayed a remarkable rally in its technical chart, where token price kept knocking out higher resistance one after another. However, a similar event happened on October 29th, when the price breakout from the prior All-Time High resistance of $141.5 mark.
The token couldn’t rally much higher, and with a daily-evening star candle at $162, the token initiated a bearish reversal that even breached the near support area around $141-135. Anyhow, the token chart also indicates a lower price rejection candle below this support level, and therefore, the crypto trader can wait for a breakthrough for the $116 mark for confirmation of short positions.