IOTA (IOTA) is approaching the end of its pattern, but neither the price action nor technical indicator provide a consensus for the direction of the next movement.
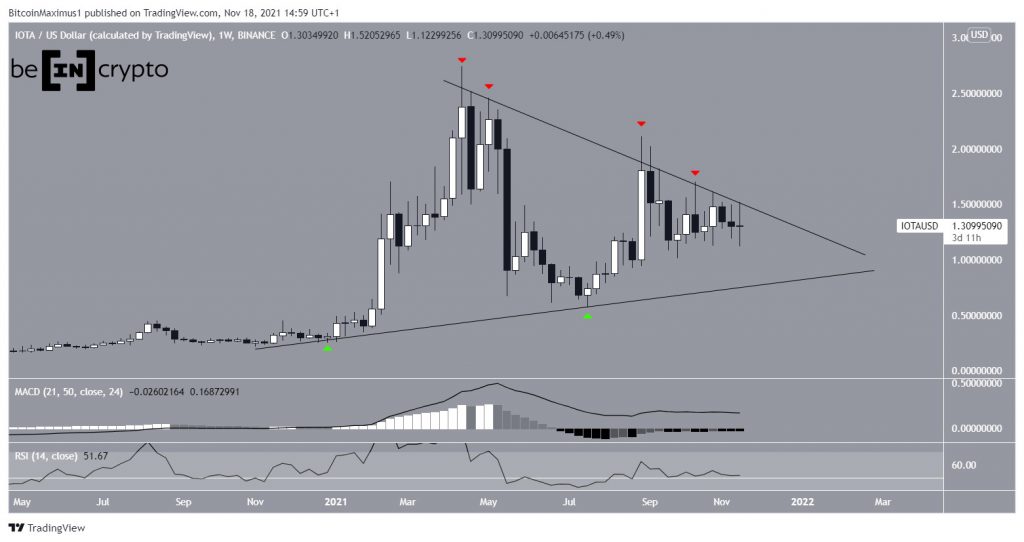
IOTA has been moving downwards since the week of April 12 – 19. The downward movement has been contained inside a symmetrical triangle, which is considered a neutral pattern. Therefore, both a breakout and a breakdown are possible.
While the support line has only been validated twice (green icons), the resistance line has been validated at least four times (red icons).
In addition to the triangle being a neutral pattern, both the MACD and RSI provide a neutral reading.
The MACD, which is created by a short- and a long-term moving average (MA), is right at the 0 line. This means that the short-term MA is moving at the same speed as the long-term one.
The RSI, which is a momentum indicator, is right at the 50 line. This is also a sign of a neutral trend.
Therefore, a look at lower time-frames is required in order to determine the direction of the trend.

Current range
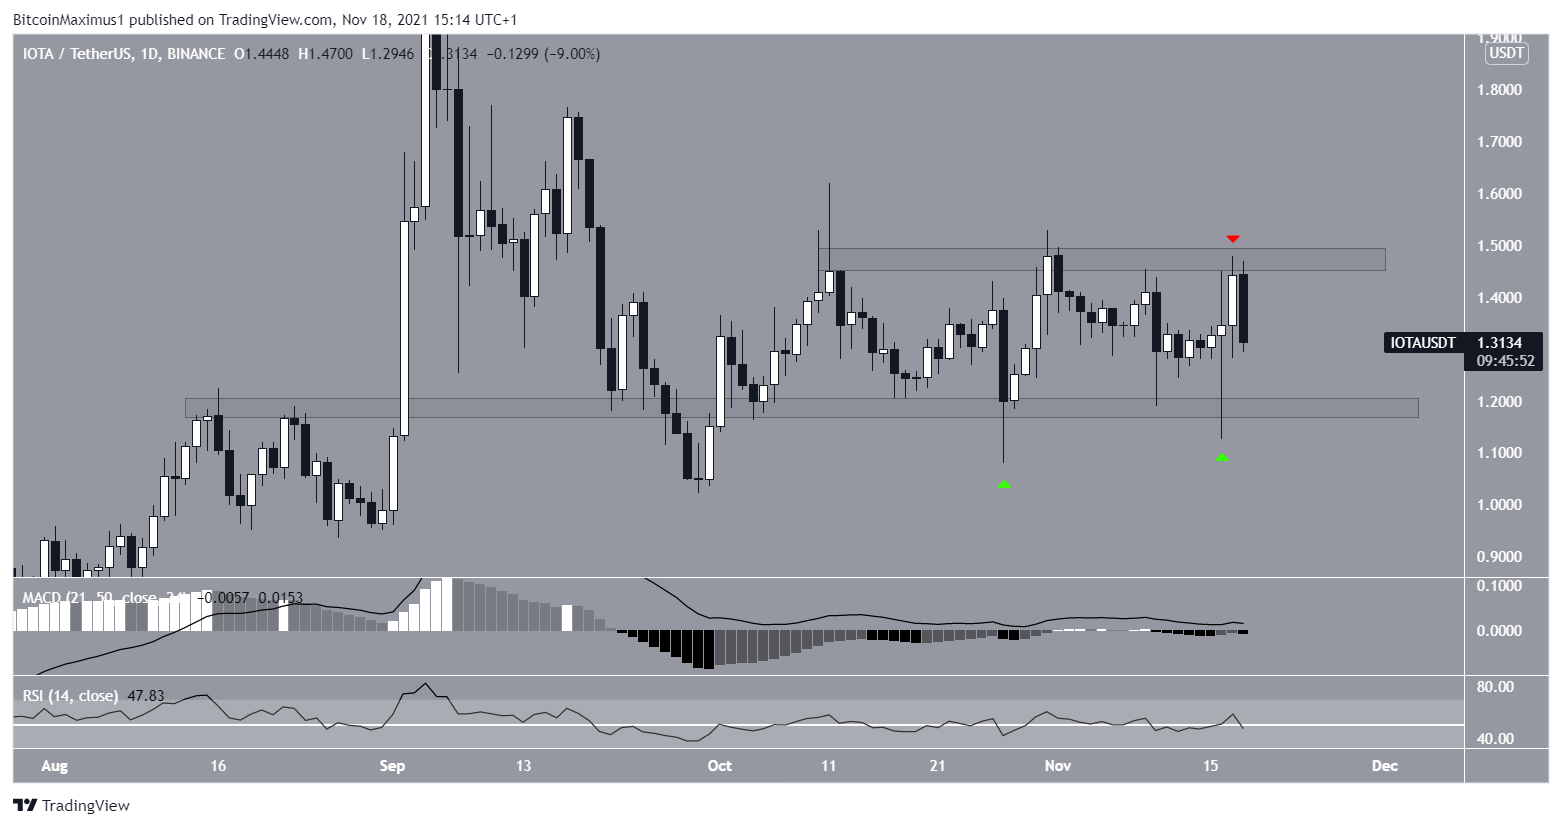
The daily chart also provides an ambiguous reading.
The token has been trading inside a range between $1.18 and $1.48 since the beginning of Oct. While it seemingly initiated an upward movement after creating a long lower wick on Nov 18 (green icon) it was rejected by the $1.48 area on Nov 17 and continued its descent afterwards.
In addition to this, the MACD and RSI are at the 0 and 50 lines, respectively, similarly to the weekly time-frame.
Therefore, either a breakout or breakdown from the range is required in order to determine the direction of the next movement.
IOTA wave count
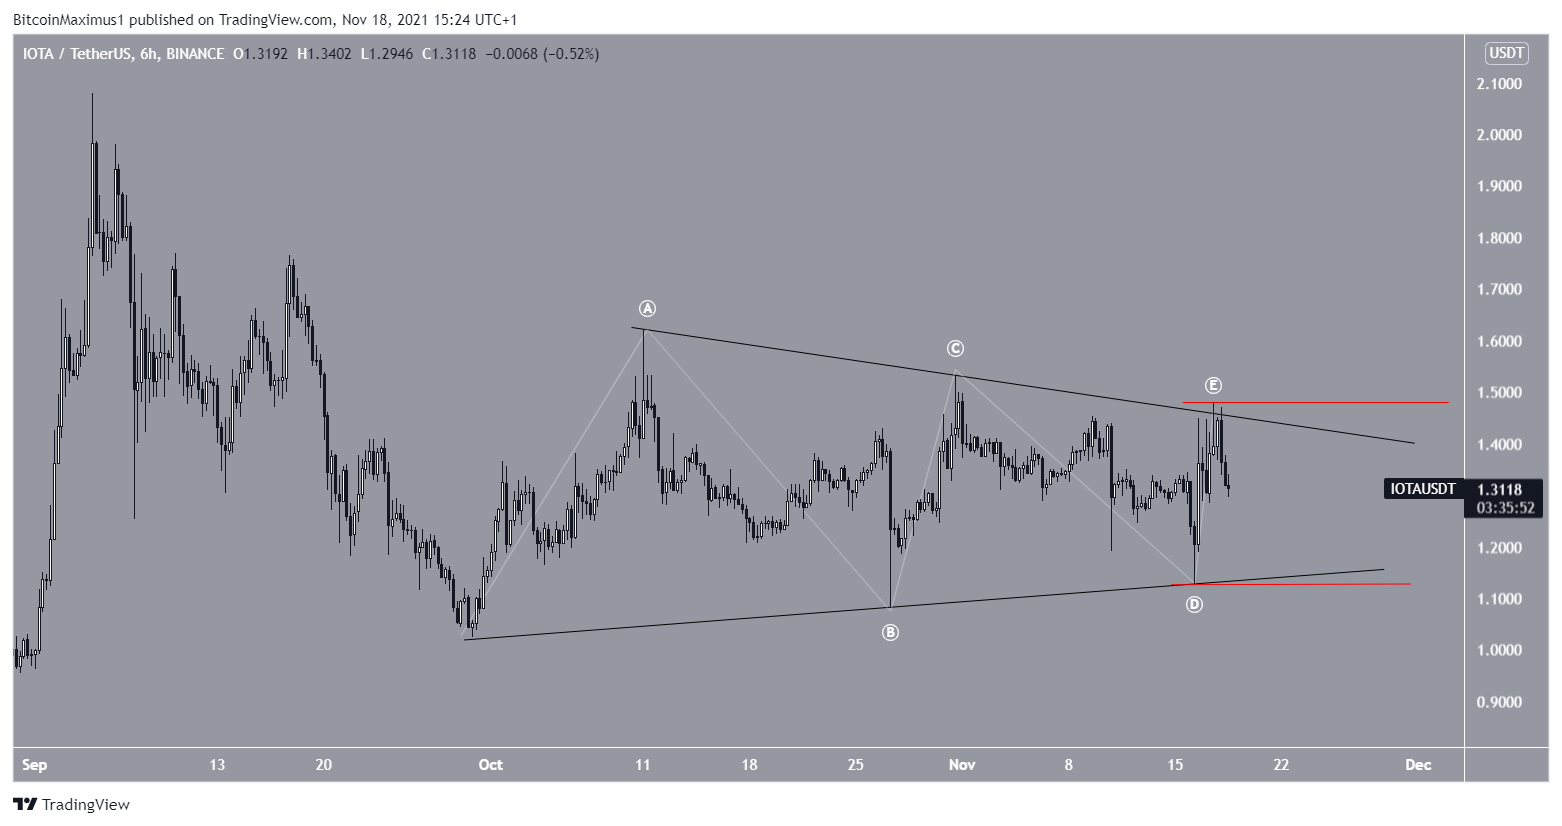
Cryptocurrency trader @Mesawine1 outlined an IOTA chart, stating that the triangle looks complete and he is waiting for either the resistance or support lines to break.

Just like the weekly time-frame, IOTA seems to be trading inside a shorter-term symmetrical triangle. AS outlined above, this is a neutral pattern.
However, due to it transpiring after a downward movement, it could be a B – wave triangle. This would mean that after the triangle is complete, another downward movement would complete the C wave and lead to new lows.
However, this pattern is not yet confirmed, and is uncertain due to ambiguity from technical indicators.
Therefore, whether the $1.12 low or $1.18 high breaks first will determine the direction of the future movement.

For BeInCrypto’s latest Bitcoin (BTC) analysis, click here.
What do you think about this subject? Write to us and tell us!
Disclaimer
All the information contained on our website is published in good faith and for general information purposes only. Any action the reader takes upon the information found on our website is strictly at their own risk.