In this last week, the XRP/ USD price tanked almost 25%, as this coin experienced strong resistance from the $1.4-$1.35 zone, obstructing all the attempts of its price to initiate a significant rally. However, the XRP is sustaining above the 200-day EMA, which is the last line of EMA defense. Check out what the price analysis has to say for XRP?
Key technical points:
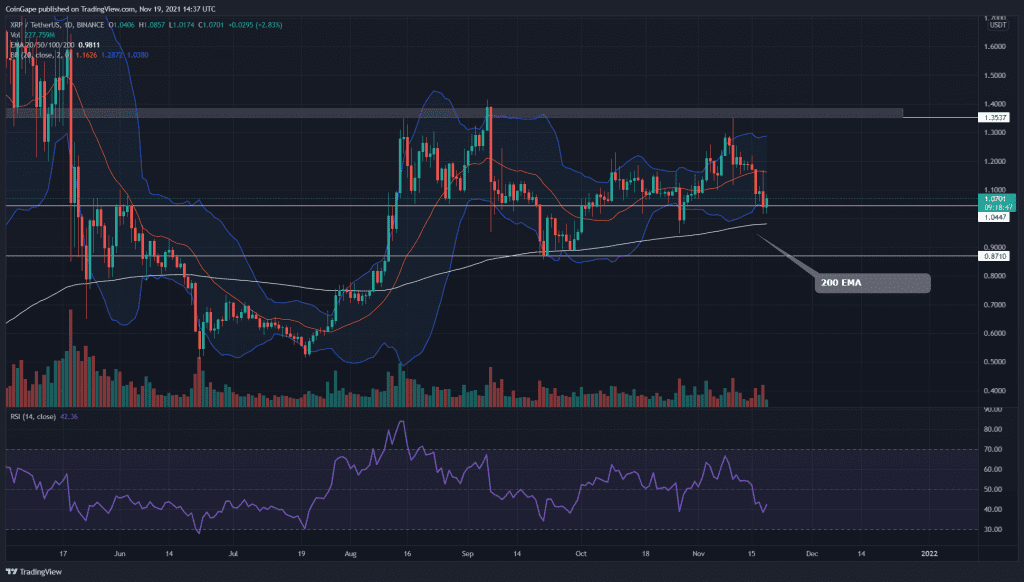
- The XRP coin forms a rising channel pattern in the daily time frame chart
- The intraday trading volume in the XRP coin is $4.2 Billion, indicating an 11.26% loss

Source- XRP/USD chart by Tradingview
The XRP/USD technical chart showed an impressive recovery from the sudden fall of September. This new rally even managed to reach the previous swing high resistance of $1.4-$1.35, which in return provided strong resistance to the price, resulting in another retracement phase in this chart.
Furthermore, with this whole wavering movement of the XRP chart, the coin price revealed a rising channel pattern in the daily time frame chart. The crypto trader could grab some great trading opportunities pattern, having predetermined targets until it remains intact.
As per the Bolliger band, the XRP price is wavering at the lower band mark, which should provide a good support level to this coin. However, the Relative Strength Index(42) indicates some weakness in this rally due to the significant drop in its value during the retracement phase.
XRP/USD Chart In The 4-hour Time Frame
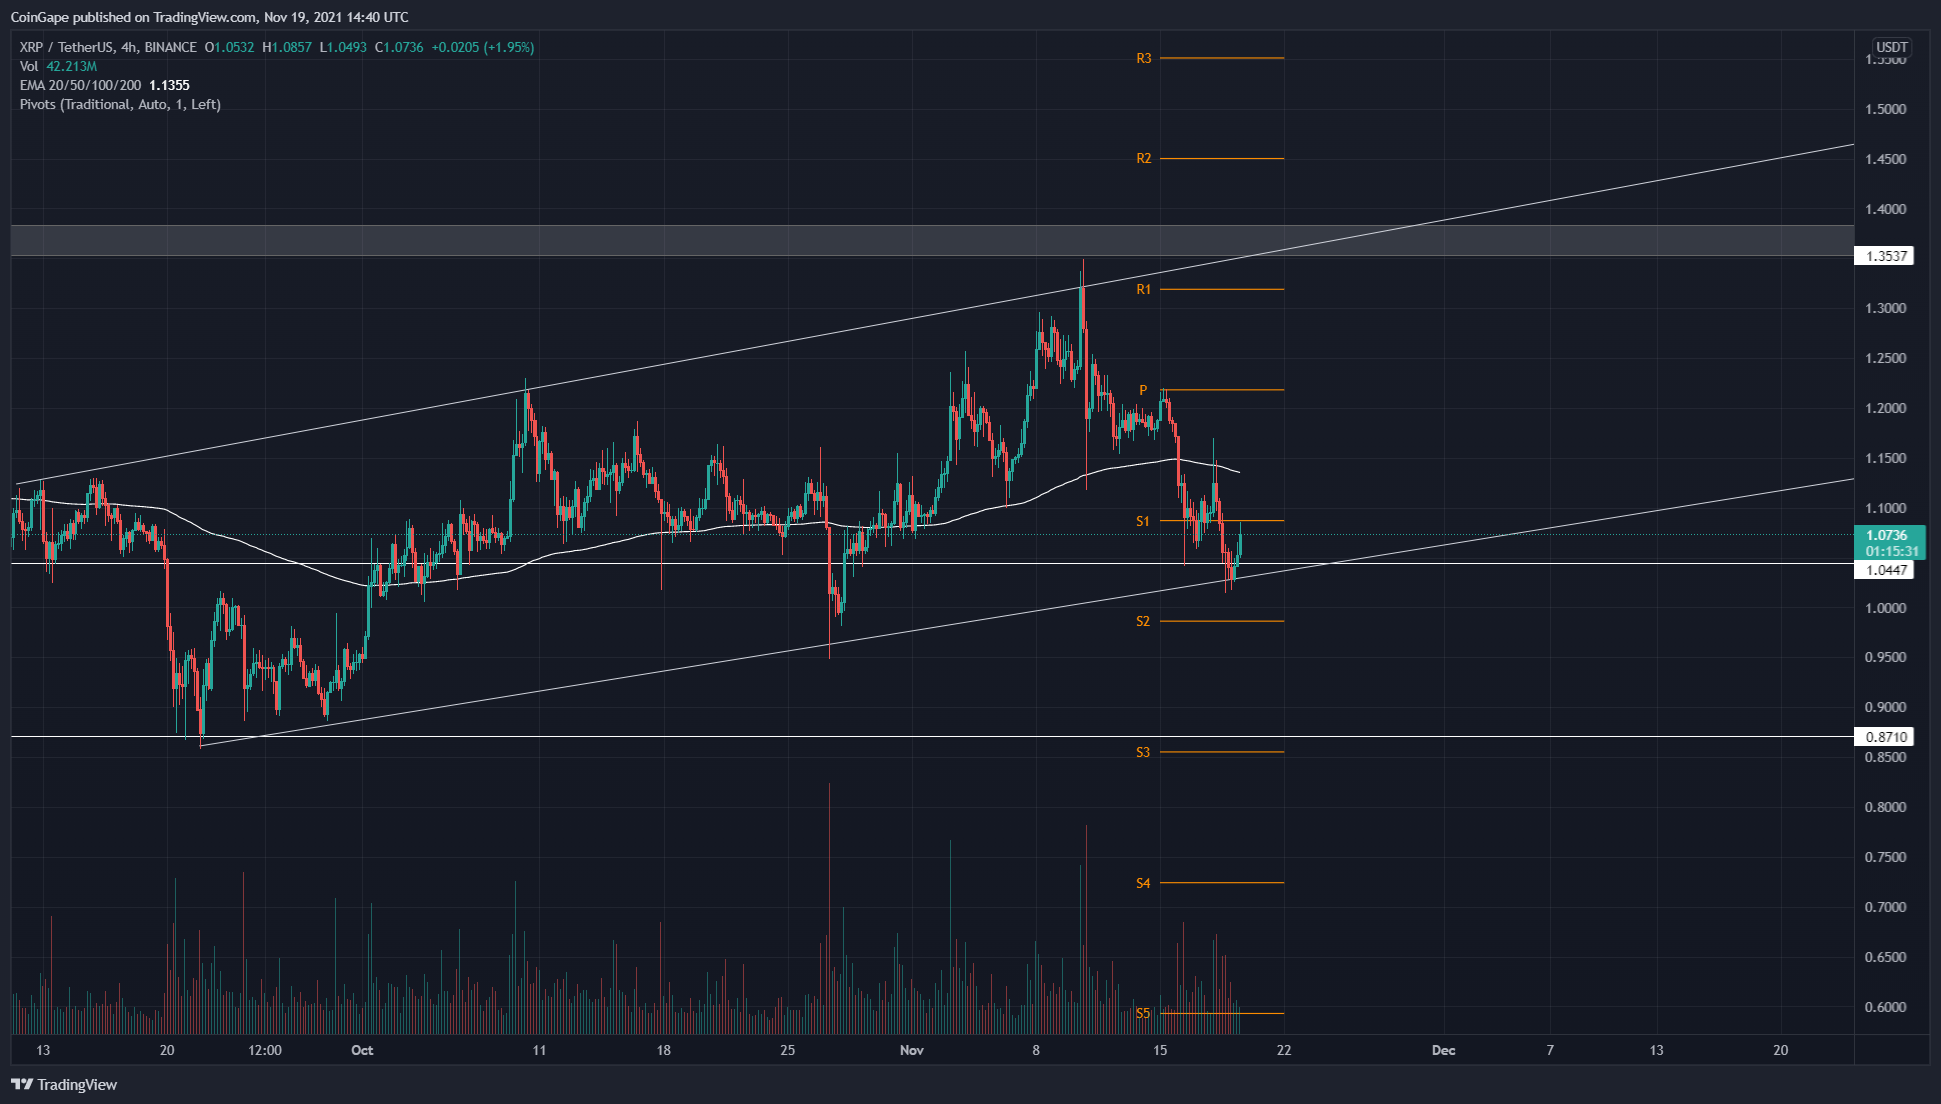
Source- XRP/USD chart by Tradingview
This lower time frame chart shows the XRP price has obtained good support from the support trendline for the channel pattern. In a favorable scenario, after bouncing from the support line, the coin price should rally to the overhead resistance, which is around 35% high.
However, the crypto traders should also know that a rising channel pattern is quite famous for an excellent selling opportunity once the price breaks down from the support trendline. Thus, in our scenario, the long trader would also get an extra confirmation once the price crossover above the 200 EMA line of the 4-hour time frame.