BeInCrypto takes a look at the price movement for seven altcoins, including Crypto.com token (CRO) and Oasis Network (ROSE), which have just reached new all-time high prices.
BTC
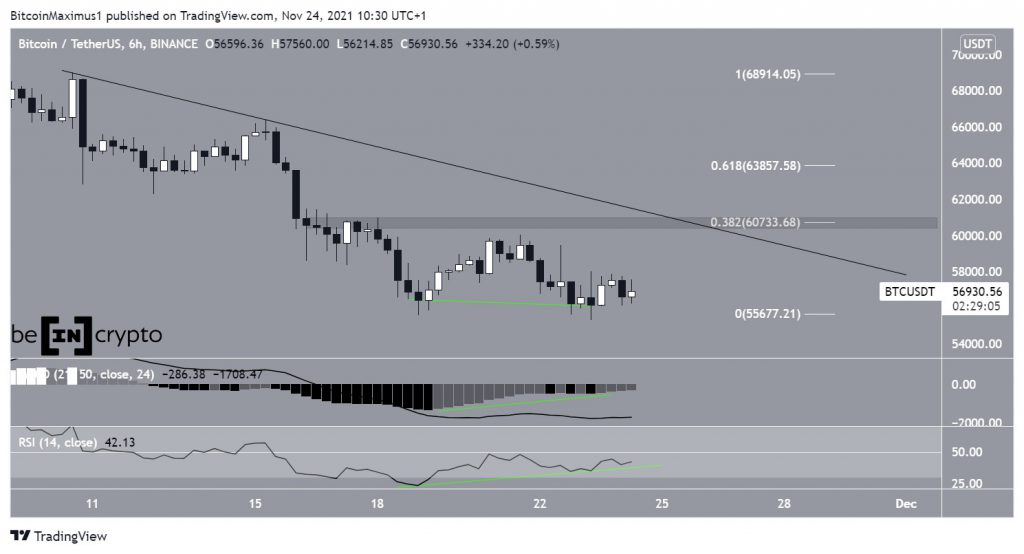
BTC has been decreasing alongside a descending resistance line since Nov 30. Despite the drop, it has created a double top, which is considered a bullish pattern, between Nov 19 and 23.
Furthermore, the pattern has been combined with bullish divergence in the RSI and MACD. This is an event that often precedes bullish trend reversals.
Therefore, it is possible that BTC will initiate an upward movement towards the closest resistance at $60,730. This is the 0.382 Fib retracement resistance level and a horizontal resistance area.
ETH
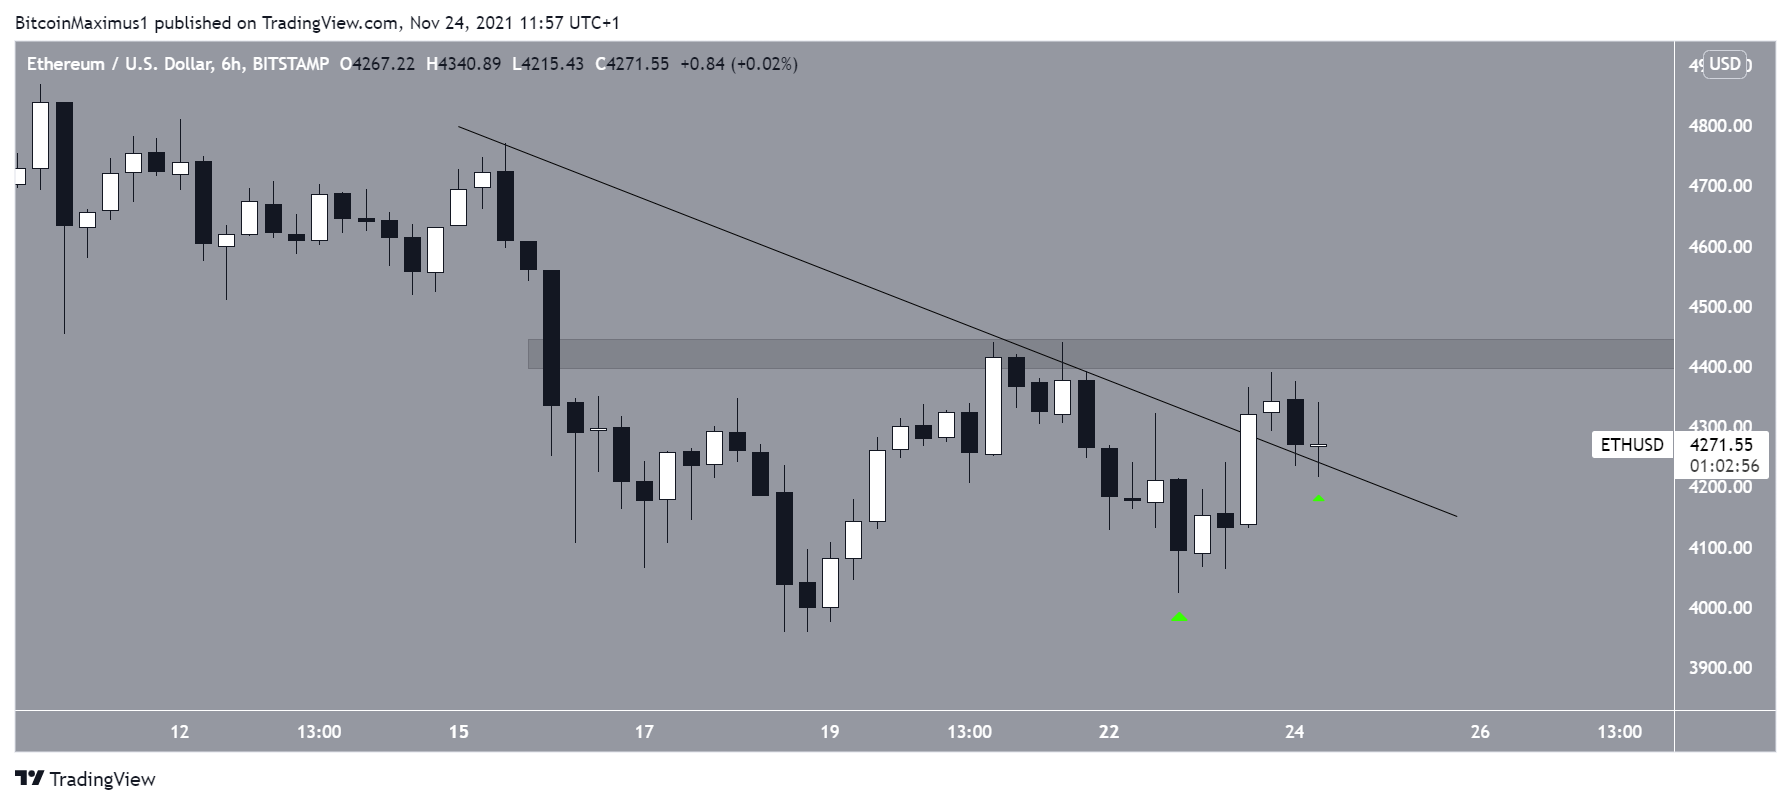
The Ethereum (ETH) movement is relatively similar to that of BTC, showing what resembles a double bottom.
However, instead of creating a slightly lower low, ETH created a higher low (green icon). This is considered a bullish sign, since ETH is projecting more strength than BTC is.
Furthermore, ETH broke out from a descending resistance line and validated it as support afterwards.
The closest resistance area is at $4,420.
XRP
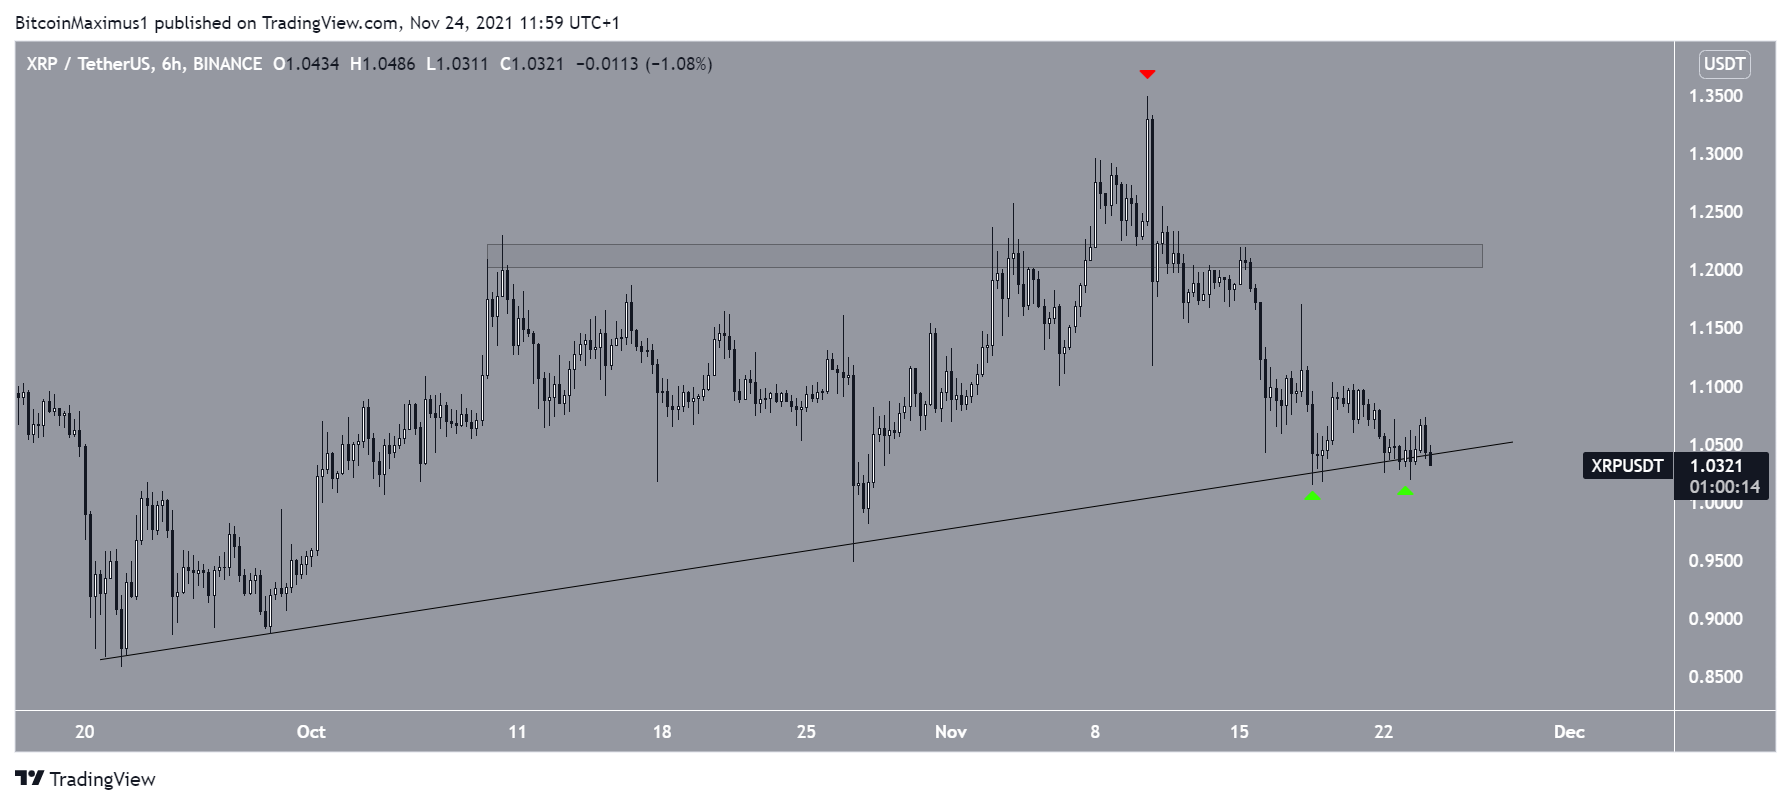
XRP (XRP) has been increasing alongside an ascending support line since Sept 18. This led to a high of $1.35 on Nov 10 (red icon).
While the token has been falling since, it validated the ascending support line twice (green icon), on Nov 18 and 22. As long as the support line remains intact, so does the upward movement.
AUDIO
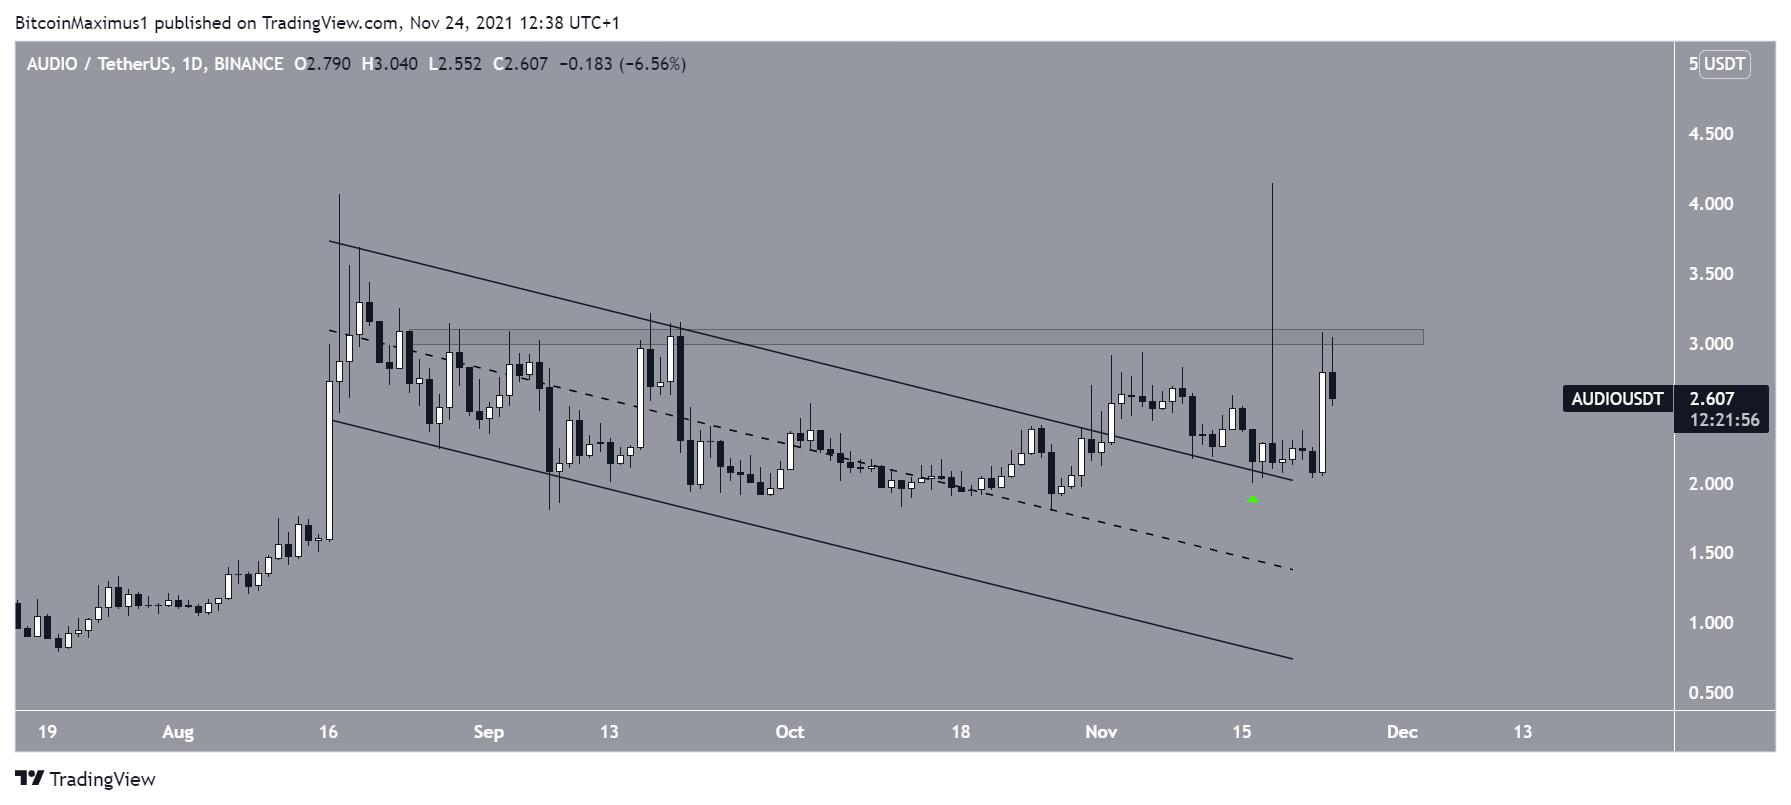
On Nov 2, Audius (AUDIO) broke out from a descending parallel channel. It returned to validate it as support on Nov 16 (green icon).
On Nov 23, it initiated an upward movement. It is currently in the process of breaking out from the $3.05 horizontal resistance area.
If successful, it could greatly accelerate its rate of increase.
CRO
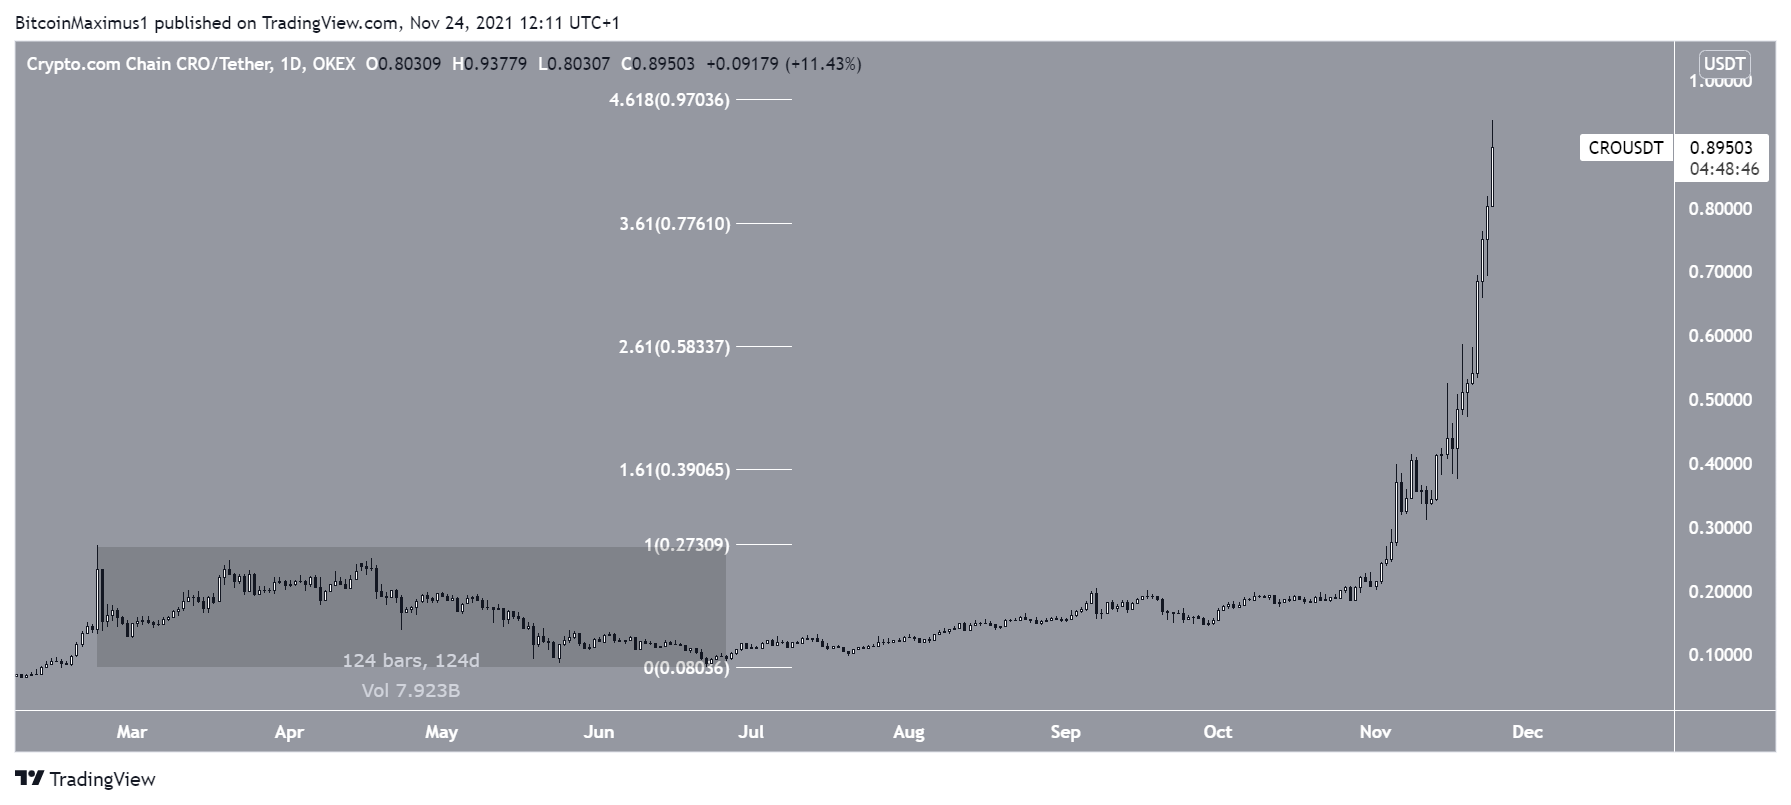
Crypto.com token (CRO) has been moving upwards at an accelerated rate since the beginning of Nov. It reached a new all-time high price of $0.945 on Nov 24.
However, it is very close to the 4.618 external Fib retracement resistance level at $0.97. Therefore, it is possible that it will reach a local top soon.
ROSE
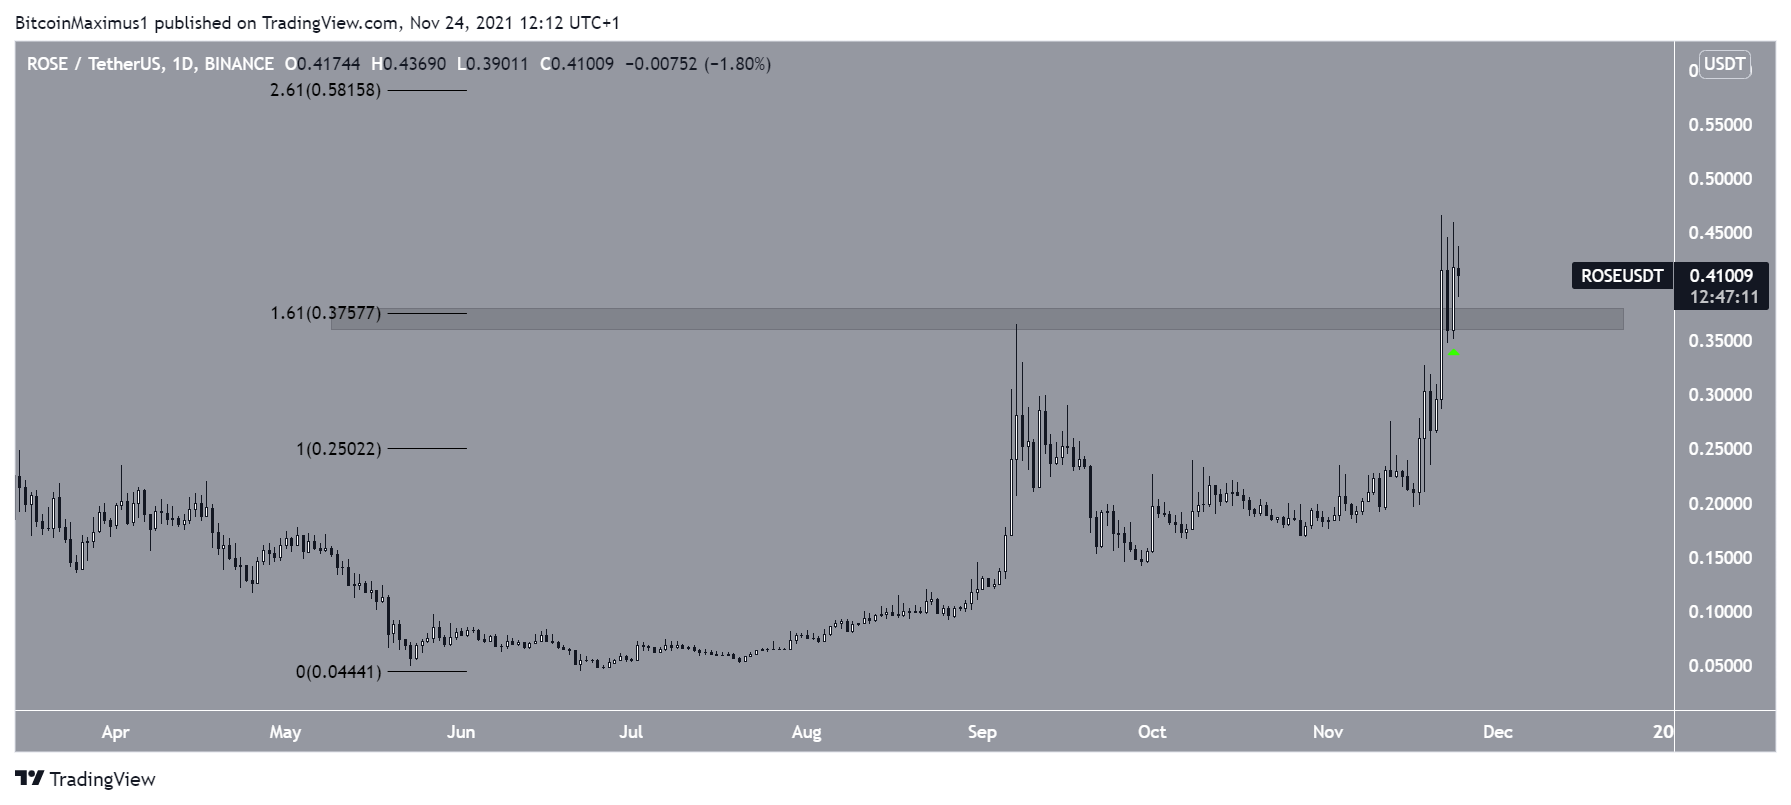
Oasis Network (ROSE) reached a new all-time high price of $0.466 on Nov 21. Afterwards, it returned to validate the $0.375 area as support (green icon), before beginning another upward movement.
On Nov 23, it created a bullish engulfing candlestick. This is a type of bullish candlestick in which the entire previous decrease is negated in one daily candlestick.
The next resistance area is at $0.58. This is the 2.61 external Fib retracement resistance level.
ZEC
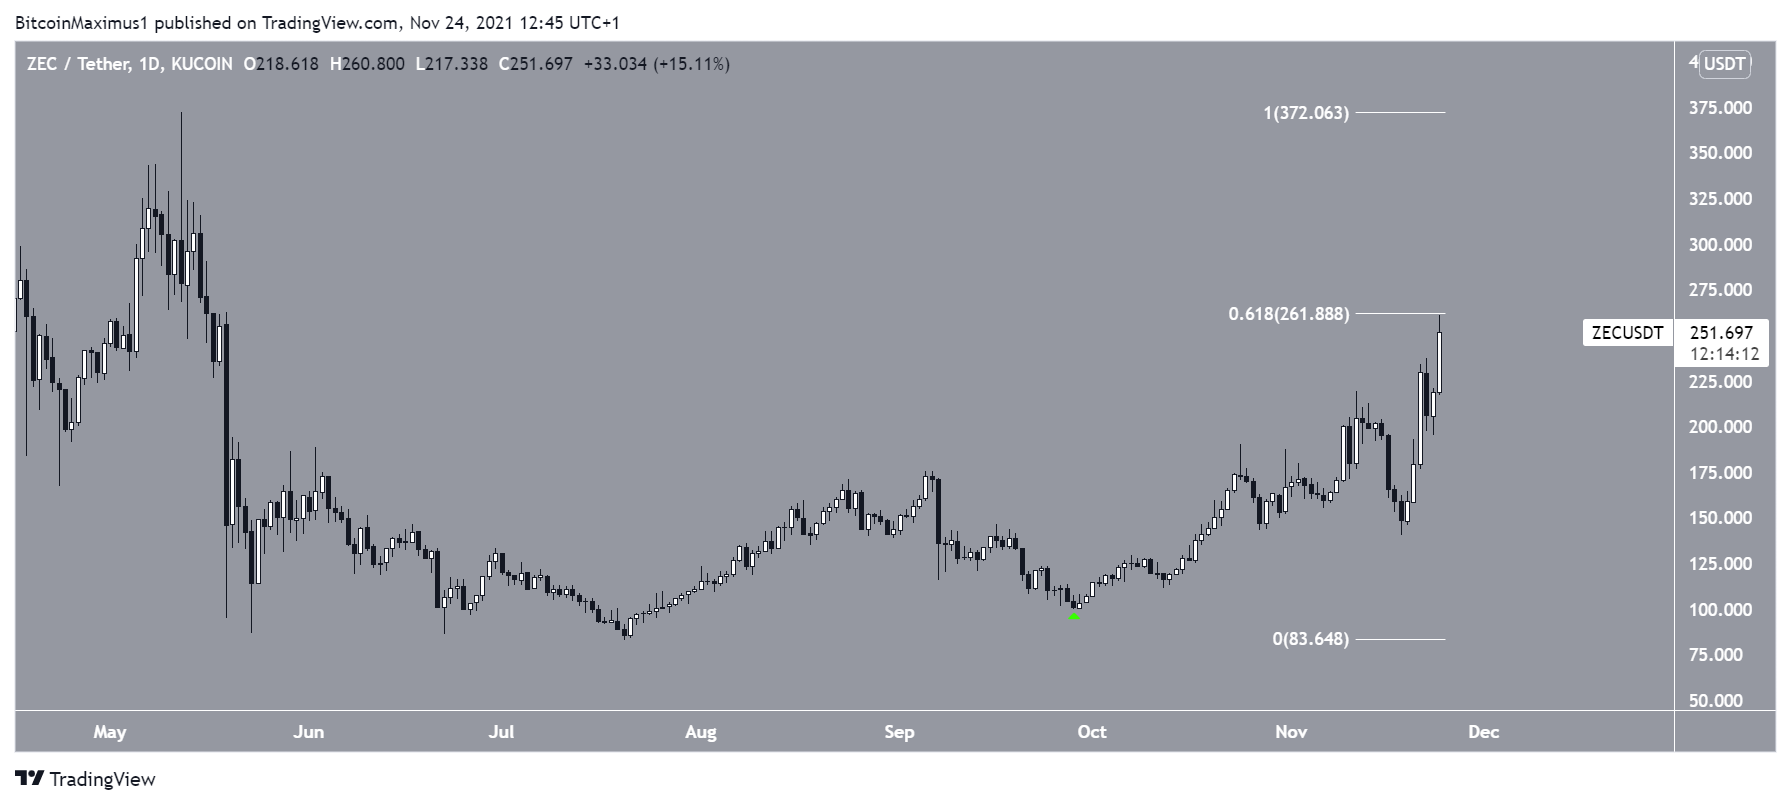
ZEC has been moving upwards since Sept 28. On Nov 24, it reached a high of $261.9. The high was made right at the 0.618 Fib retracement resistance level (white).
A movement above this area would likely take ZEC towards its $372 yearly highs, since there is no other resistance left to clear.
For BeInCrypto’s previous Bitcoin (BTC) analysis, click here.
Disclaimer
All the information contained on our website is published in good faith and for general information purposes only. Any action the reader takes upon the information found on our website is strictly at their own risk.

