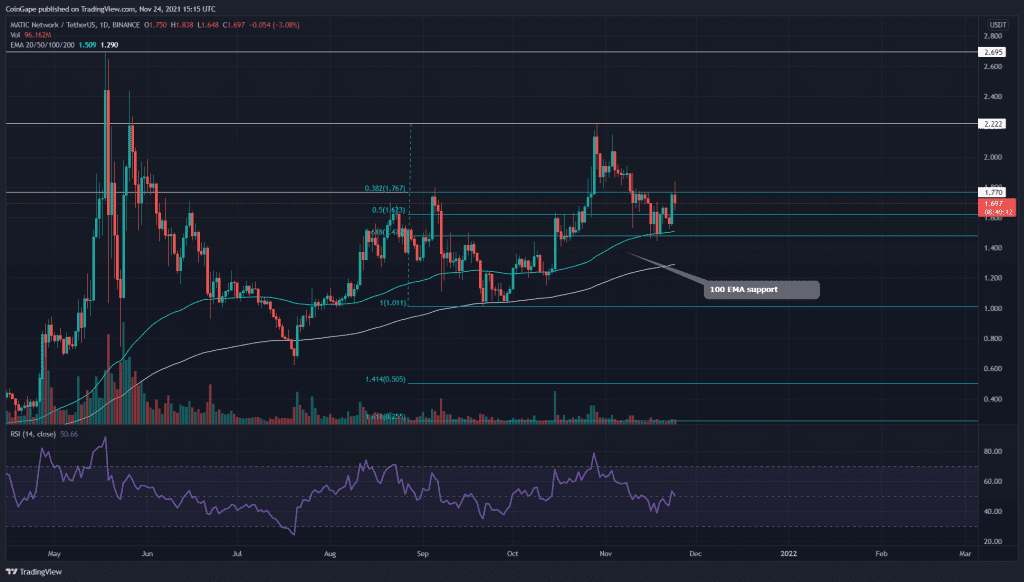
The technical chart of the MATIC coin shows a steady uptrend of higher highs and lower highs. After its recent rejection from the $2.2, the coin price was plunged to the 0.618 Fibonacci retracement level. However, the price indicated a presence of good demand pressure from this support; can we expect to uptrend to continue from here?
Key technical points:
- The MATIC coin price trying to breach a significant horizontal resistance level of $1.7
- The 100-day EMA line is providing strong support to the coin price
- The intraday trading volume in the MATIC coin is $1.5 Billion, indicating a 70.25% gain

Source- MATIC/USD chart by Tradingview
The MATIC coin displayed a remarkable rally in October, making a new higher high of $2.2. Later the coin price was rejected from this level and entered a retracement phase. The first half of November contributed entirely to this pullback; however, the chart displayed sufficient demand pressure at the 0.168 FIB level.
With the confluence of the 0.618 FIB level and 100 EMA at this level, the coin obtains enough support to initiate a new rally. The overall trend for MATIC coin is bullish as per the crucial EMAs(20, 50, 100, and 200).
The Relative Strength Index(51) experience a significant drop during the retracement phase, and therefore, it should now have enough room to support a new rally.
MATIC/USD Chart In The 4-hour Time Frame

Source- MATIC/USD chart by Tradingview
What stands between the coin price and the previous swing high is an important resistance zone of $1.81-$1.76. The current price of the MATIC coin is $1.71, and it is facing strong rejection from the overhead resistance.
Though the price still has support from the 50 and 200 EMA line in the 4-hour time frame, a better confirmation for the price recovery will be obtained when the price breaks out from the $1.81.
The traditional pivot shows remarkable confluence with the MATIC/USD chart levels. According to these pivot levels, the crypto traders can expect the next resistance after 1.83, at the $1.93 mark, followed by $2. As for the opposite end, the support levels are $1.6 and $1.45.
.
.
.
.
.
.
.
.
.
.
.
.
.
.
.
.