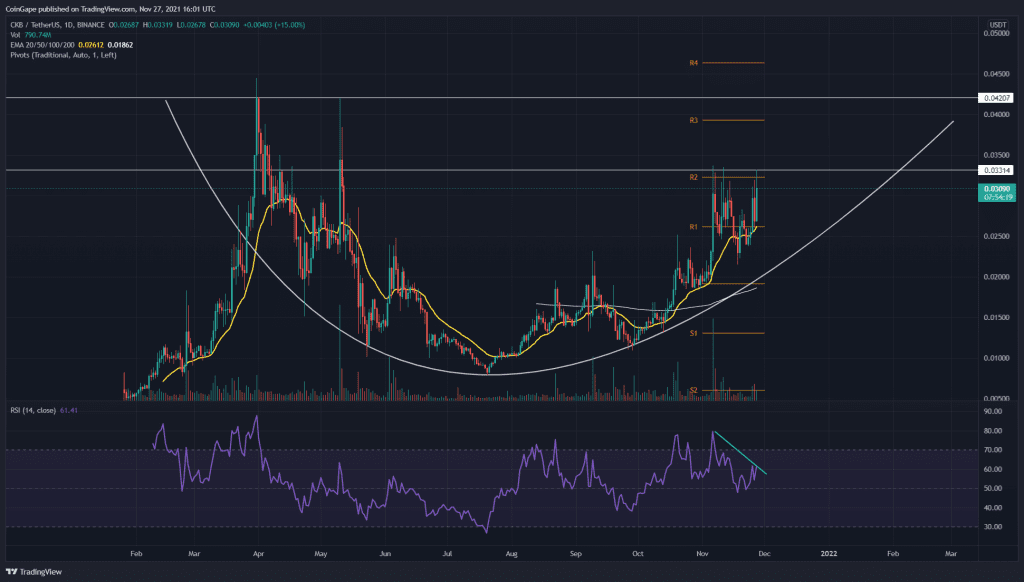
The amazing recovery of the CKB coin price from the $0.0078 mark after the fall of more than 80% from the $0.041 mark attempts to complete a rounding bottom pattern. The coin price is currently struggling to overcome the $0.33 resistance, and once it gathers enough bullish momentum to make the breach the crypto trader would get a great spot to go long.
Key technical points:
- The CKB coin displays a rounding bottom pattern formation with the support of a growing uptrend.
- The intraday trading volume in the CKB coin is $226.6 Million, indicating a 326.8% gain.

Source- CKB/USD chart by Tradingview
The CKB coin price continues the uptrend from the $0.0078 mark after the huge supply dump near the $0.041 mark resulting in the downfall of more than 80% within months. However, the uptrend reincarnates the bullish presence in the CKB coin price and aims to break above the $0.33 mark.
However, presently the coin price shows a strong higher price rejection from the resistance level of $0.33 mark evident by the long wick candle formation. However, the growing uptrend momentum and the multiple big green candles indicate a high possibility of an uptrend.
The crucial EMA levels (20, 50, 100, and 100) maintain a bullish alignment in the daily chart with constant support from the 20 and 50-day EMA. The Relative Strength Index (62) shows an uptrend in the slope as it gradually rises higher above the 50% mark. However, the slope approaches the overbought boundary in the daily chart.
CKB/USD Chart In The 4-hour Time Frame

Source- CKB/USD chart by Tradingview
The CKB coin price action struggles to break above the $0.33 mark resulting in the formation of a strong resistance zone. However, the recent rise indicates a strong possibility of a bull running above this resistance, and the breakout of the zone will be an excellent entry spot.
However, traders must confirm the sustainability of this bullish breakout as the coin will also posses a threat for fakeout indicated by the bearish divergence in RSI.
According to these pivot levels, the crypto traders can expect the nearest resistance at $0.040, followed by $0.045. As for the opposite end, the support levels are $0.025 and $0.021.