After rejecting from the $3 mark, the FLOKI token entered this retracement phase. The token price tried hard to sustain above the $2 support but overpowered bears didn’t let that happen, and the price continued to fall. The token has again breached another significant support level of $1.5, which suspects more sell-off in the FLOKI token.
Key technical points:
- The FLOKI token chart shows a death crossover of the 50-and-200-day EMA
- The intraday trading volume in the FLOKI token is $27.9 Million, indicating a 26.91% loss

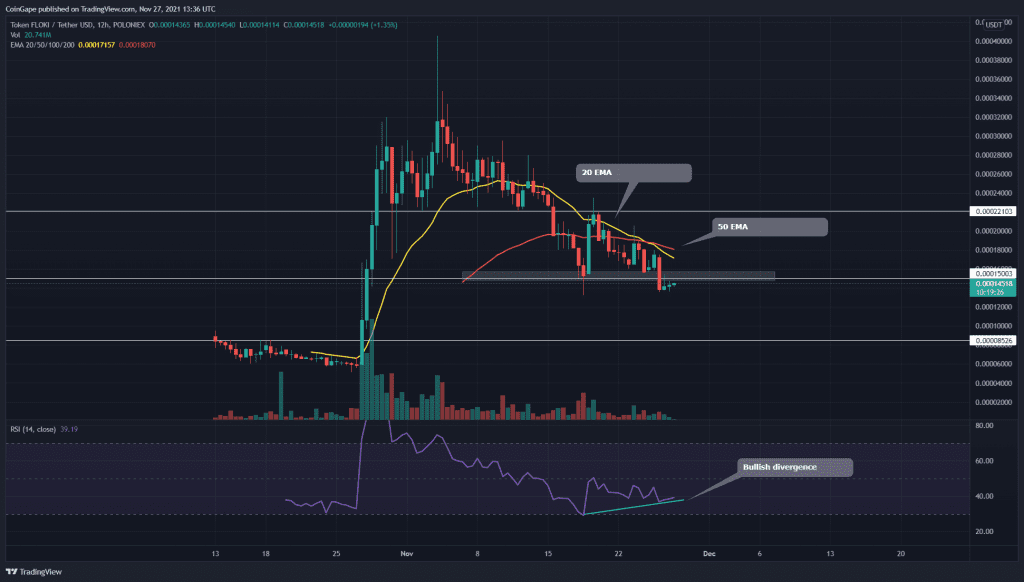
Source- FLOKI/USD chart by Tradingview
The correction phase initiated on November 4th has come a long way now as it has dropped 65% from its All-Time High in these three weeks. The FLOKI price has recently breached another support level of $0.000015, threatening for even more fall in the upcoming session.
The crucial EMA levels(20 and 50) are in support of bears, indicating a downtrend in the FLOKI token. These lines could provide good resistance to the price.
The Relative Strength Index(40) states the bearish sentiment within this token. However, the RSI line also projects a bullish divergence indicating the bulls increasing in strength.
FLOKI/USD Chart In The 4-hour Time Frame

Source- FLOKI/USD chart by Tradingview
The FLOKI token price is currently trying to retest the new resistance of the $0.00015 mark and check for the intensitty of supply pressure. If the price obtains sufficient resistance from this level the token price could drop to the $0.0001 mark.
However, in case the token price jumps above this overhead resistance, the market sellers still have another edge on their side i.e., descending resistance trendline. This trendline provides dynamic resistance to the token price since early November and is still intact.
Therefore, the long traders should confirm if these barriers are taken out before they expect a proper recovery in FLOKI token. The MACD indicator projects bearish momentum in this token, as both the MACD and signal are moving lower to the neutral zone.