This 2021 New Year Token (NYT) Technical Analysis is based on the study of technical indicators. Below, we have outlined the key factors that contributed to our New Year Token (NYT) price analysis.
Table of contents
Introduction
New Year Token is the user’s personal guide to the celebration and festive mood. Its native token is NYT. The NYT token has 0% transaction tax. It also contains Magic boxes with NFTs and also different rarities for the NFTs. Moreover, the Better rarity indicates better reward in the NFT rewards pool. Added to this, NFT rewards pools which indicate after the end of the year owners of NFTs will get their reward based on the amount of NFTs and their rarity.
Funds for the NFT rewards pool come from every purchase of the Magic box and from the special contract which fills up the pool with money based on trading volume. There is a farm with Ice shards, where people can stake NYT-BUSD and get ice shards, which are used for buying magic boxes.
The platform had a fair launch. The NYT platform has an audit from InterFi. The main goal of the NYT platform is that the token price has to reach $1. Moreover, the liquidity of the NFT is locked for 1 year.
NYT Current Market Position
According to CoinMarketCap, the NYT is at $0.0023 with a 24-hour trading volume of over $199,899, at the time of writing this NYT technical analysis. This means the price of NYT has decreased by over 34.33% in the last 24 hours. This happened because of CoinMarketCap listing and huge wave of speculators. Now, price will continue to grow every day, New Year effect will highly affect price of token, due it’s connected with New Year.
NYT token has a current circulating supply of 392,104,501.00 NYT. For those interested in buying the token, NYT can be purchased and sold on PancakeSwap, on the poocoin, or through swap on the token website.
NYT Technical Analysis 2021
Currently, NYT holds 3732nd place on CoinMarketCap in terms of market capitalization. Do you think the latest upgrades, changes, and developments in the NYT blockchain can help the crypto’s price to reach higher? Now let’s proceed to the chart in this NYT price prediction article.
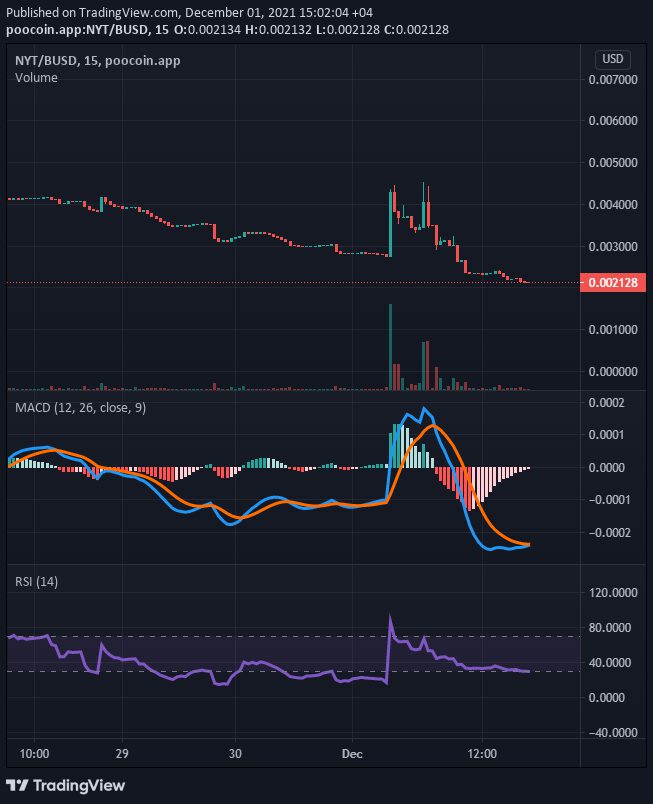
Based on the chart above, NYT positions itself along with the raging bulls. Today, NYT trades at a high price of $0.0023. In addition, we can see that NYT recently performed a Lower High and Lower Low pattern. In addition, this pattern represents a short-term bearish.
In other words, NYT is gearing itself for a possible bullish rally in the days to come. If this happens, the crypto might go beyond its resistance level and reach the bullish price. Of course, this is most likely to happen if the bullish market continues to reside with NYT.
Conversely, if the bulls turn against crypto, the price of NYT might fall. In short, NYT might break out from its uptrend position and nosedive to a bearish price. Indeed, this price level is not a good picture in the eyes of the investors. In other hand fundamental analysis of NYT token is pretty good and investors can expect good growth afterwards.
NYT Technical Analysis — MACD, RSI, MA, EMA
When it comes to Moving Average Convergence/Divergence (MACD), the MACD stands just below the signal indicator making a bearish crossover. This represents that traders and investors may expect bearish days ahead. However, if the MACD points towards an upward direction, then we may expect more bullish days ahead.
Furthermore, the Relative Strength Index (RSI) is at level 40, this shows that NYT is in a nearly oversold state. As a result, traders need to trade safely, as major price reversal could happen soon.

The chart above indicates the 50-day Moving Average and 30-day Exponential Moving Average of NYT. Currently, NYT is in a bearish state. Notably, the NYT price is above 30-MA and 50-EMA, so it is completely in a bearish state. Therefore, there is a high possibility of a trend reversal at any time.
NYT Technical Analysis — RVOL, ADX, RVI
Since the start of 2021, NYT’s price has seen many bullish moves which are higher than the previous one. Additionally, those are often followed by consolidations, fluctuations, and corrections right away. Now let’s look at NYT’s Average Directional Index (ADX).
The above chart shows the ADX of NYT stays near the range of 60, so it indicates a very strong trend.
Conclusion
NYT 2021 technical analysis shows that the cryptocurrency has a fantastic future ahead in 2021. Also, the project looks promising as it has high aims, a use case, and clear goals that target a broad market. Bullish NYT price prediction 2021 is $0.25. NYT could also reach a new all-time high price if investors have decided that NYT is a good investment in 2021. Furthermore, together with growing adoption, positive price predictions, and a community composed of thousands of retailers, NYT is likely to be a good investment this year.
Disclaimer: The views and opinions expressed in this article are solely the author’s and do not necessarily reflect the views of CoinQuora. No information in this article should be interpreted as investment advice. CoinQuora encourages all users to do their own research before investing in cryptocurrencies.