BeIn Crypto takes a look at Bitcoin (BTC) on-chain indicators, more specifically the Net Realized Profit Loss (NRPL) indicator, in order to better gauge the scale of losses during the Dec 4 drop.
Realized losses
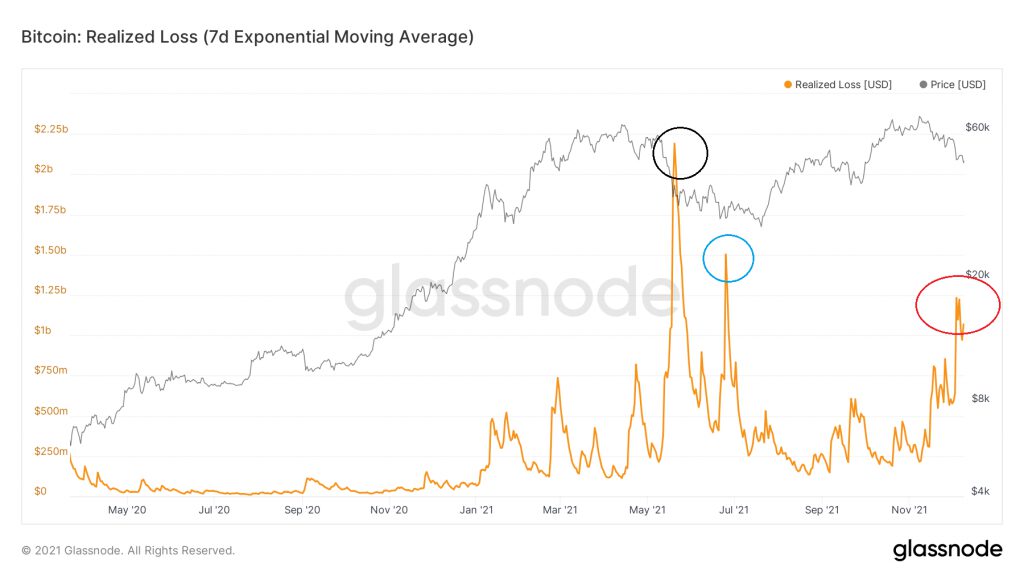
Realized losses measure the value of all coins who were moved at a lower price than they were bought. Therefore, it measures the total dollar amount of losses from all coins that were sold at a loss.
Since the upward movement began in March, realized losses have reached an all-time high of $2.191 billion on May 20 (black circle). At the time, BTC had just fallen from roughly $57,000 to $37,000.
Realized losses spiked once more (blue circle) on June 26, during a drop towards $31,000.
However, they have been negligible in the period since, due to the fact hat BTC has been moving upwards.
However, on Dec 4, there was a sharp fall in the BTC price, leading to a low of $42,00, from highs near $60,000 just one week earlier.
This led to realized losses spiking to $1.233 Bn (red circle), the third-highest yearly value to date.

Net realized profit and loss
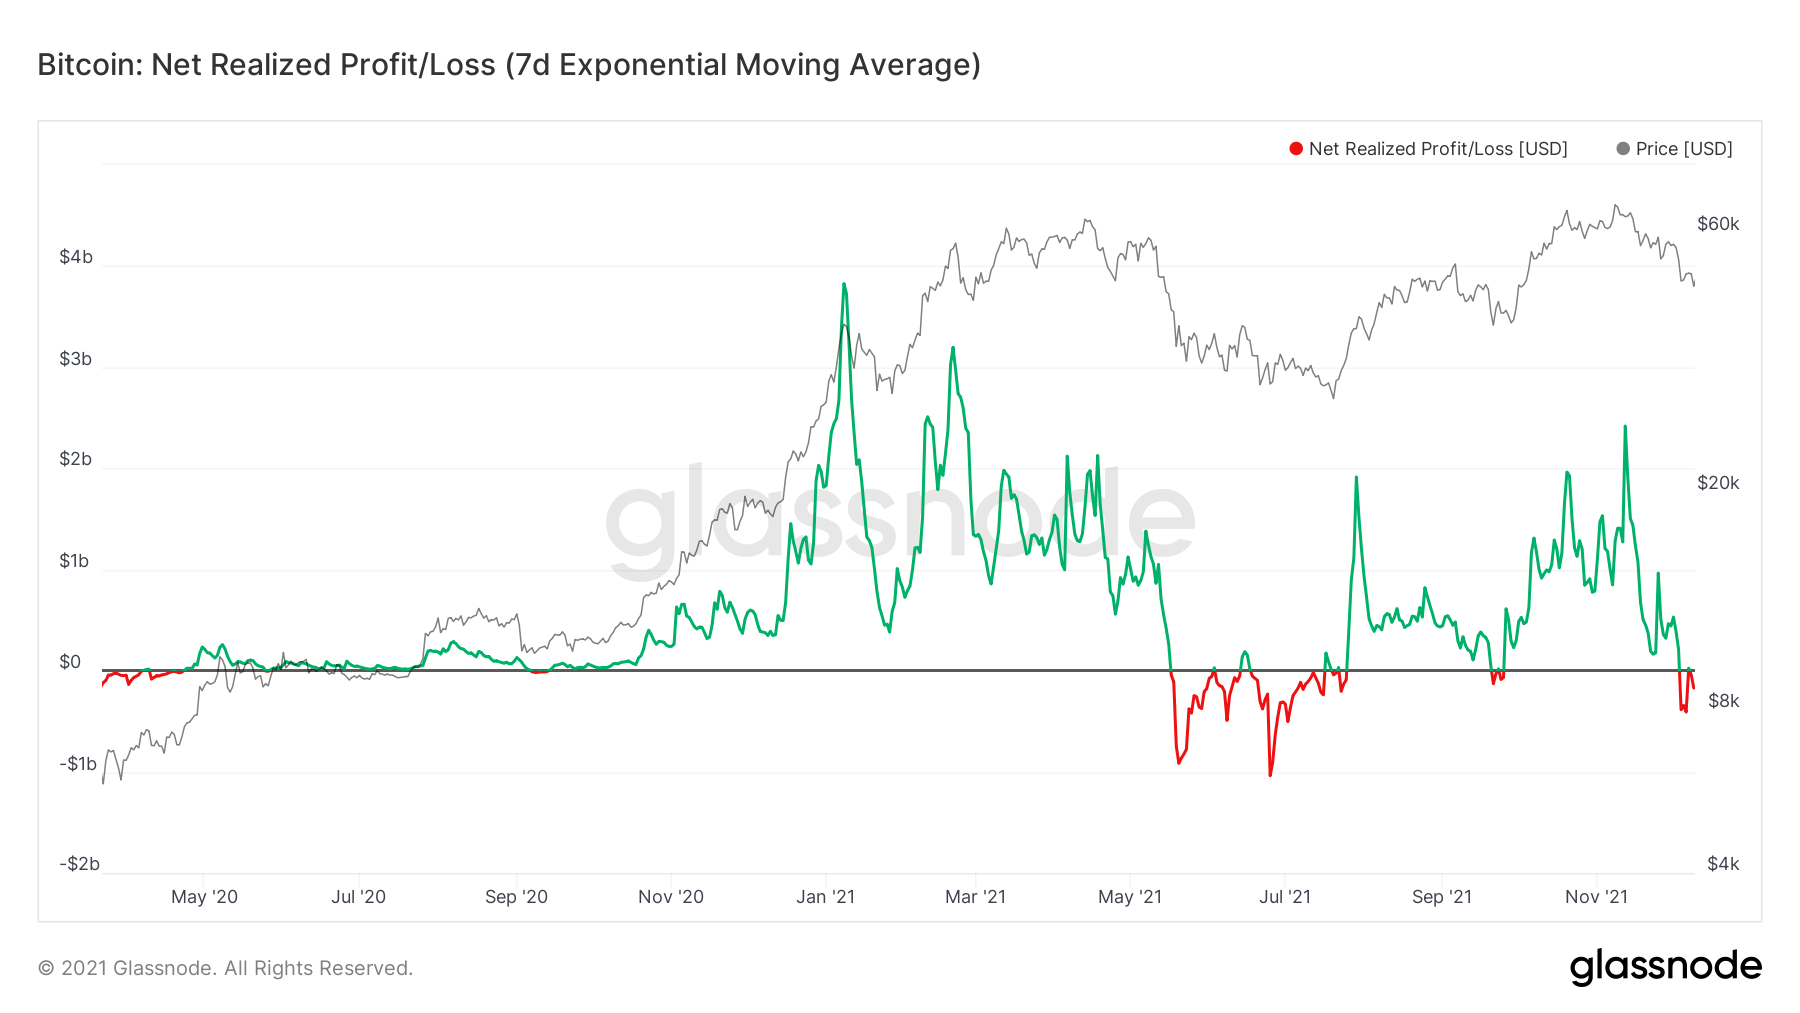
The Net Realized Profit/Loss indicator shows the net value of all transactions in the market for a specific day. Therefore, realized losses are subtracted from realized profits.
This indicator gives a similar reading to the realized loss one, since it shows three downward spikes, which transpired on May 20, June 26 and Dec 4. The Dec 4 spike was the smallest out of the three.
However, unlike the unrealized loss indicator, the all-time low reading for NRPL transpired on June 26. This means that despite the significant loss on May 20, the considerable coins that were sold at a profit served to negate said loss, hence leading to a smaller total loss than on June 24.
Who did the selling?
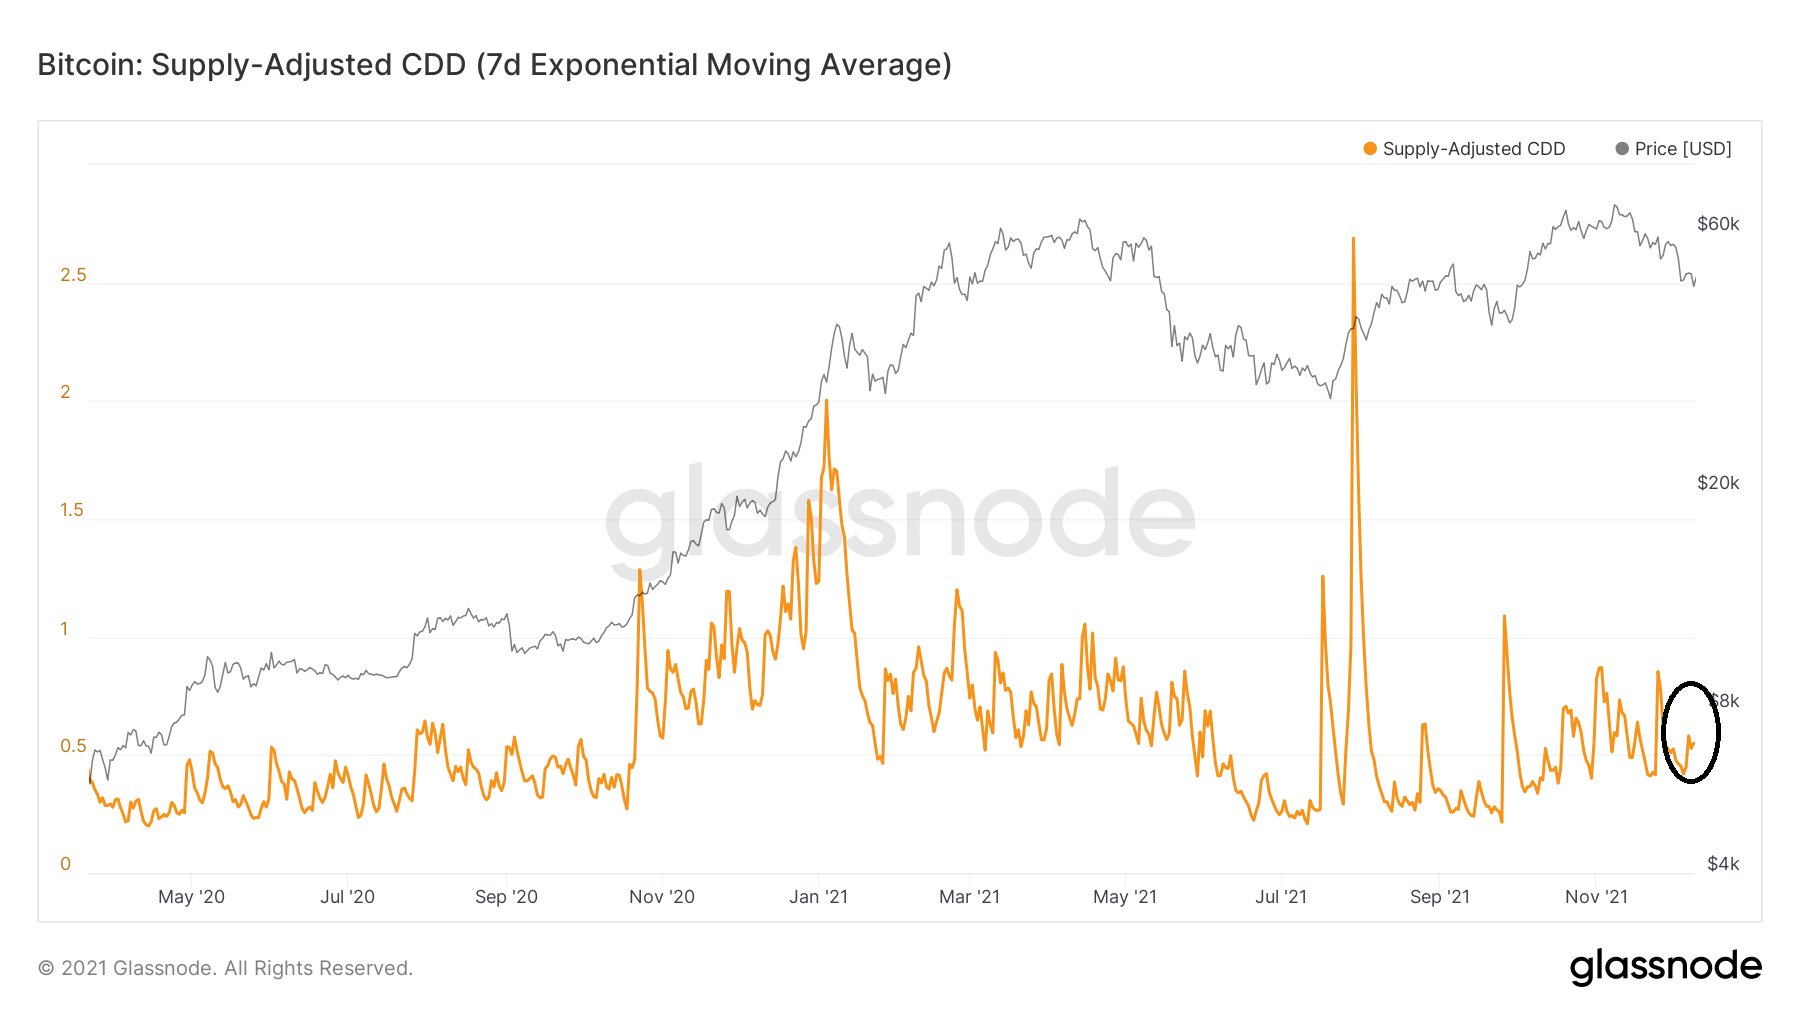
Coin days destroyed (CDD) is an indicator that measures the lifespan of coins that are being sold on the market. Each day a coin is unspent, it gains one “coin day.” Therefore, a high indicator reading means that coins have been unspent for a significant period of time.
However, the indicator did not spike during Dec 4. This suggests that the majority of coins sold were of short-term holders.
This also makes sense when considering the high readings of realized losses, since short-term coins were bought near the $60,000 top.
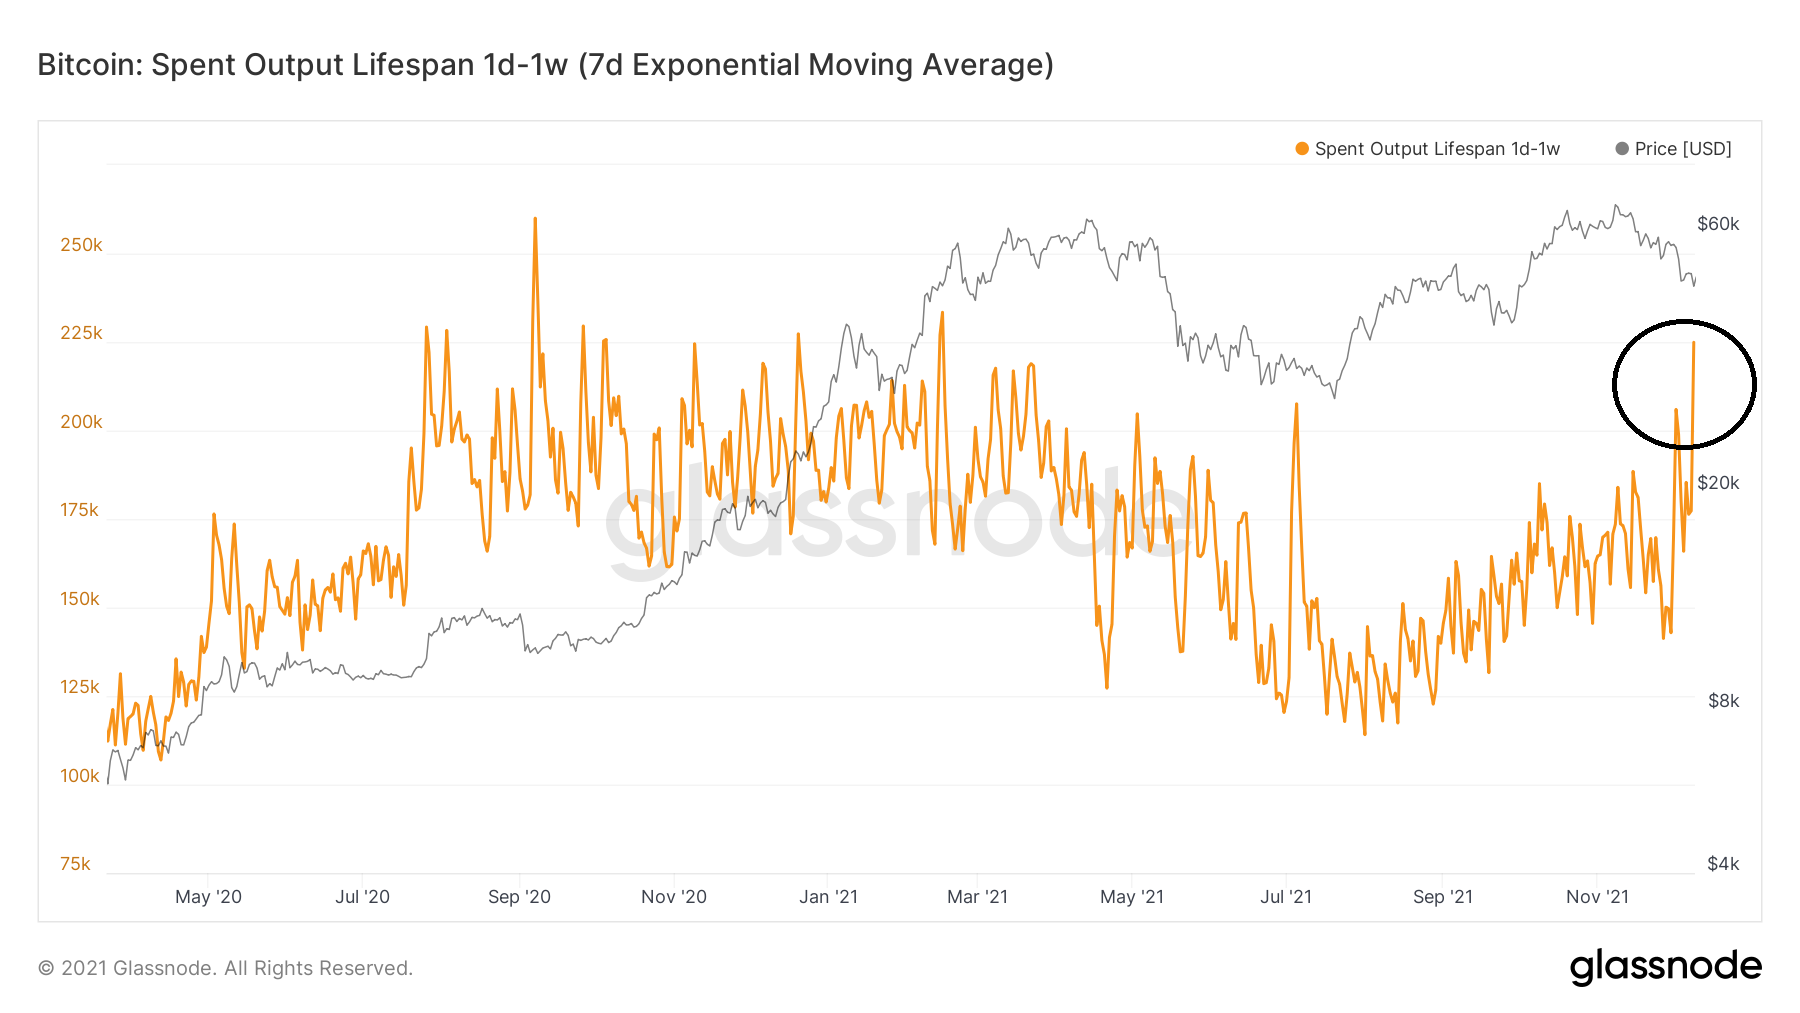
This is confirmed when looking at spent outputs between 1 day – 1 week, which spiked considerably on Dec 4.
Therefore, the majority of coins sold at a loss on Dec 4 were bought between Nov 27 and Dec 3.
For BeInCrypto’s latest Bitcoin (BTC) analysis, click here.
Disclaimer
All the information contained on our website is published in good faith and for general information purposes only. Any action the reader takes upon the information found on our website is strictly at their own risk.