Avalanche posted new gains over the last 24 hours and moved up the list to trade within the top 10 cryptocurrencies. This appreciation on its charts came right after Avalanche announced that USD coin would be available on the Avalanche network, therefore, introducing ease of liquidity into the financial equation.
At press time, the coin was trading for $103.24, and it zoomed up on its chart by 14%. This development brought tons of advantages; integrating a stable coin can bring down transaction fees. AVAX will no longer have to depend on Ethereum transactions to settle the fees. While AVAX displayed bullish sentiments, this is what awaits the coin in its upcoming trading sessions.
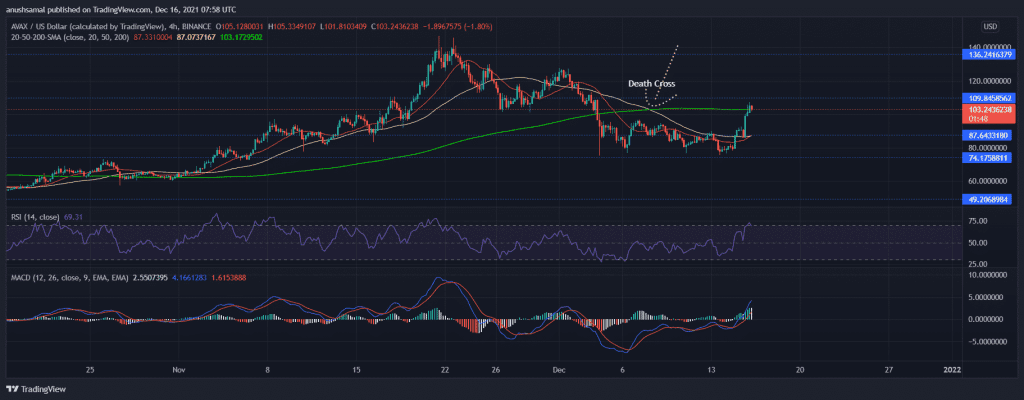
Avalanche – AVAX/USD, Four-Hour Chart

After a period of intense sell-off, as witnessed post the Death Cross, Avalanche was successful in invalidating its bearish thesis due to recent developments. The immediate resistance level of the coin stood at $109.84, and if the bulls don’t tire out immediately, the coin could find itself trading near the $120 mark. The local support level for the coin stood at $87.64, falling below which there’s solid support at the $74.17 price level.
Technical indicators highlighted bullishness. After securing a multi-week high, the Relative Strength Index was above the half line into the overbought territory. The bulls have finally managed to push the prices above the 20-SMA line. MACD also displayed positive price action as the indicator met with a bullish crossover.
WAVES/USD, Four-Hour Chart

Waves have seen a southbound movement for the past month and a half. Although the digital currency witnessed sporadic upward movements on its chart, it kept encountering significant selling pressure. At the time of writing, however, Waves happened to secure new gains; it went up by 4.4% and was trading for $16.91. With a continued increase in buying strength, the coin could attempt to trade near its price ceiling of $20.16. The robust resistance mark for the coin stood at $23.90.
Indicators suggested that the prices could belong to the bulls in the short term. However, a move in the opposite direction couldn’t be ruled out. The Bollinger Bands indicated that price volatility could rise, highlighting that WAVES might trade out of its present price channel. The Relative Strength Index floated in the bullish territory, marking some optimism in prices in the upcoming trading sessions.
Lastly, MACD underwent bullish crossover, hinting at a short-term bullishness.
SAND/USD, Four-Hour Chart

Sand portrayed outstanding rallies since the end of October. Nonetheless, these rallies have also faded out quickly. Recently, prices of Sand had formed a descending triangle, which meant that the coin represented a bearish market downtrend. Over the last 24 hours, the coin invalidated the possible downward breakout and gained 7.7%, breaking above its descending triangle. At press time, Sand was priced at $5.12 with an immediate resistance at $5.66.
Directional Movement Index preferred the bulls correspondingly; MACD also did the same. The near-term technicals favored the bulls, with the Relative Strength Index parking itself above the half-line into the positive territory. However, a small downtick also could push the buying pressure back into the bearish zone. The following trading prices would hover around the $3.38 and $2.32 mark in such an event.