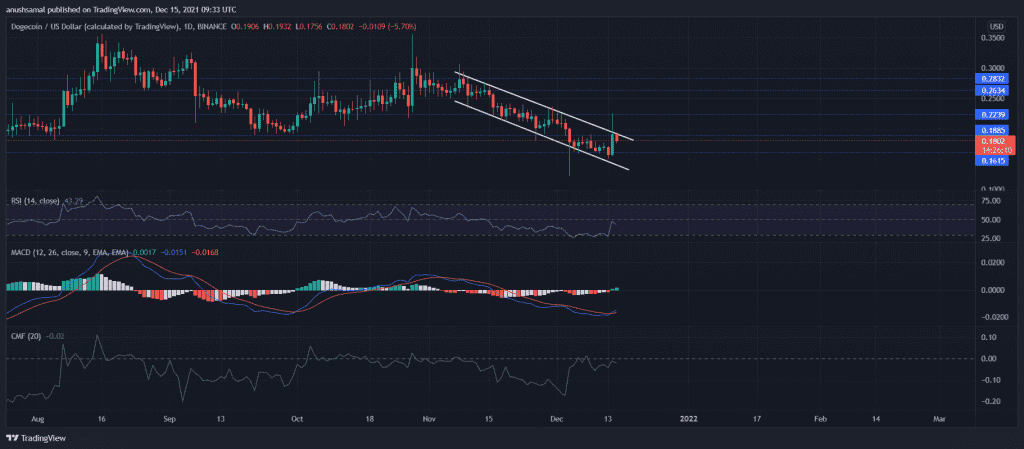
Dogecoin zoomed up the charts as Elon Musk stepped in to announce that Tesla will accept Dogecoin as payment for Merchandise on a test basis and the prices of the coin surged 14% over the last 24 hours. At the time of writing, it was trading for $0.180. Although the technicals pointed towards a brief recovery from the chart below, it is visible that Dogecoin had continued to trade inside its descending channel since mid-November.
DOGE/USD One-Day Chart

This certainly isn’t the first-ever time that DOGE went into a frenzy after Elon Musk’s comment, it has happened before too. The above chart displays that Dogecoin was still trading between the descending channel. The nearest resistance mark for the coin stood at $0.188, in case the coin continues to register gains, it would finally trade above the descending channel. On the flip side, the support line for the coin was at $0.161.
MACD displayed green histograms and also flashed a bullish crossover. Chaikin Money Flow also remained positive as capital inflows were more than capital outflows. Conversely, The Relative Strength Index had noted an uptick, but at press time it declined slightly. According to the indicator, buying strength of the coin has declined.
If Doge breaks above the $0.188 resistance, the next trading level of the coin stood at $0.223 and then at $0.263.
AVAX/USD One-Day Chart

Avalanche was priced at $91.72 and it appreciated 15.1% over the last 24 hours. Immediate resistance of the coin stood at $109.84, breaking above which the coin could trade near the $136.24. The buying strength of the coin also recovered in the past 24 hours. The token has found support on the $74.17 and $49.20 level respectively. The rise in the prices of the coin has made the technicals look slightly bullish in the last day.
The Relative Strength Index displayed a slight recovery in the number of buyers. MACD also exhibited declining bearish pressure as the red histograms decreased in size. On the Directional Movement Index the -DI had crossed over the +DI which meant that bearish force still hadn’t fizzled out completely.
NEAR/USD One-Day Chart

Near Protocol was trading for $10.29, the coin gained 7.4% over the last 24 hours. The recent surge in prices caused the buyers to enter the market, the immediate resistance for NEAR stood at $12.39. On the charts, price of the coin stood above the SMA-20, which indicated that the price momentum was dominated by buyers the market.
Correspondingly, the Relative Strength Index also rose above the half-line which highlighted that buyers had come back into the market. Awesome Oscillator displayed green signal bars in indication of bullish price action.
The support level of the coin stood at $9.23 and then at $8.29, failing to stay above which it could land on $6.90.