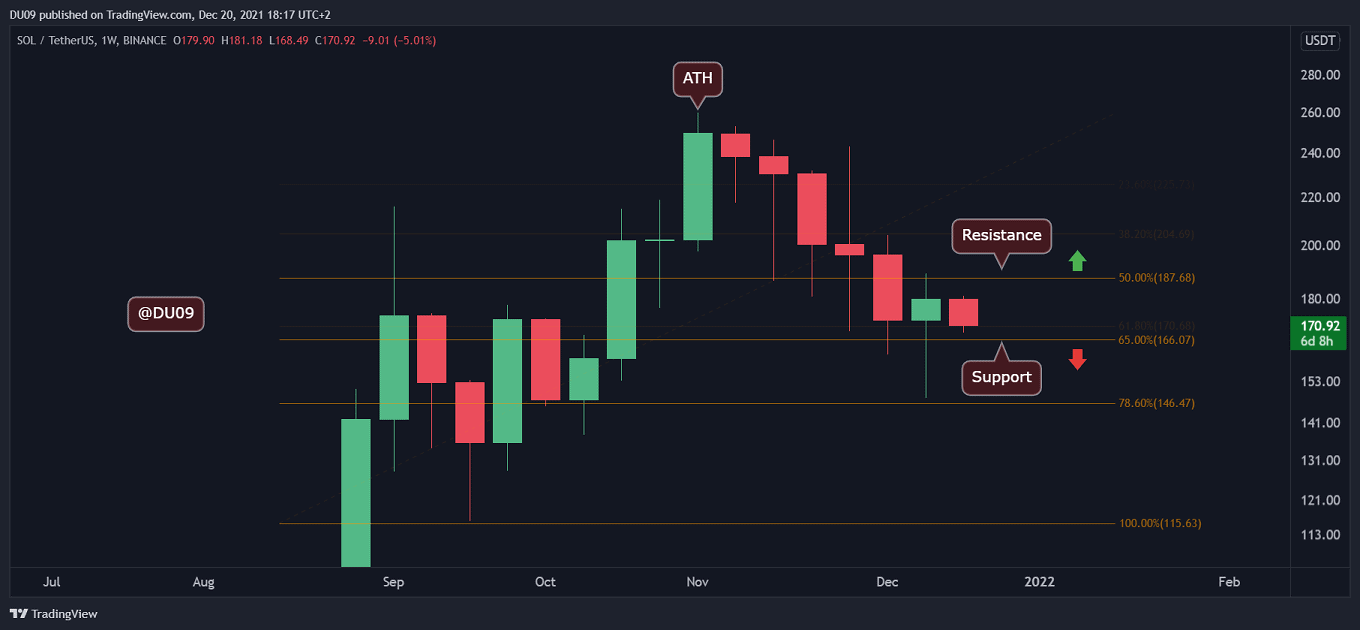
Key Support levels: $166, $146
Key Resistance level: $187
SOL completed a bearish MACD cross on the weekly timeframe after the all-time high and this downtrend only intensified since. SOL has to keep its price above the key support at $166 if there is any hope to stop the current decline. If it fails, the price might fall lower in search of new support. The current resistance is at $187, where SOL was sharply rejected.
Technical Indicators
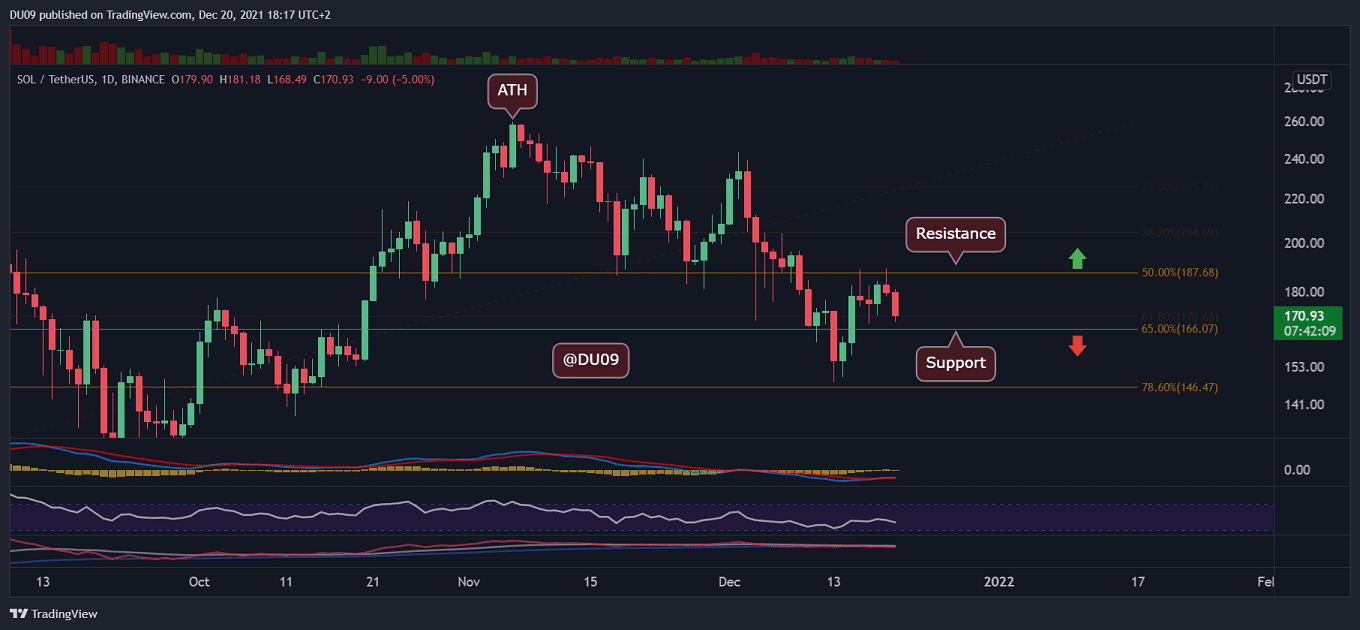
Trading Volume: Volume has remained constant during this downtrend, and bears do not appear satisfied yet.
RSI: The RSI on daily is falling and has remained in the bearish zone (under 50 points). It seems likely to drop again, and the hope is that if it reaches overbought conditions, the bulls will bounce back.
MACD: The MACD on the daily timeframe did a bullish cross three days ago, but this now appears to reverse back down. The weekly MACD is firmly bearish and likely will stay so for a few weeks at least.
Bias
The current bias is bearish considering the indicators.
Short-Term Prediction for SOL Price
SOL’s correction will most likely continue, and there may be at least one more Elliot wave down before a potential reversal. If the current support at $166 fails, then SOL has another chance to reverse the downtrend at $146.
Binance Free $100 (Exclusive): Use this link to register and receive $100 free and 10% off fees on Binance Futures first month (terms).
PrimeXBT Special Offer: Use this link to register & enter POTATO50 code to get 50% free bonus on any deposit up to $1750.
Disclaimer: Information found on CryptoPotato is those of writers quoted. It does not represent the opinions of CryptoPotato on whether to buy, sell, or hold any investments. You are advised to conduct your own research before making any investment decisions. Use provided information at your own risk. See Disclaimer for more information.
Cryptocurrency charts by TradingView.