The GALA token indicates that the overall trend is still bullish. This pair is currently in a retracement phase which has caused a 50% discount on the token’s value. Moreover, the price has recently given a bearish breakout from a descending triangle pattern, indicating extension for this down rally.
Key technical points:
- The GALA token price drops below the 200 EMA in the 4-hour time frame chart
- The intraday trading volume in the GALA token is $171.4 Million, indicating a 53.44% gain.
 Source- =Tradingview
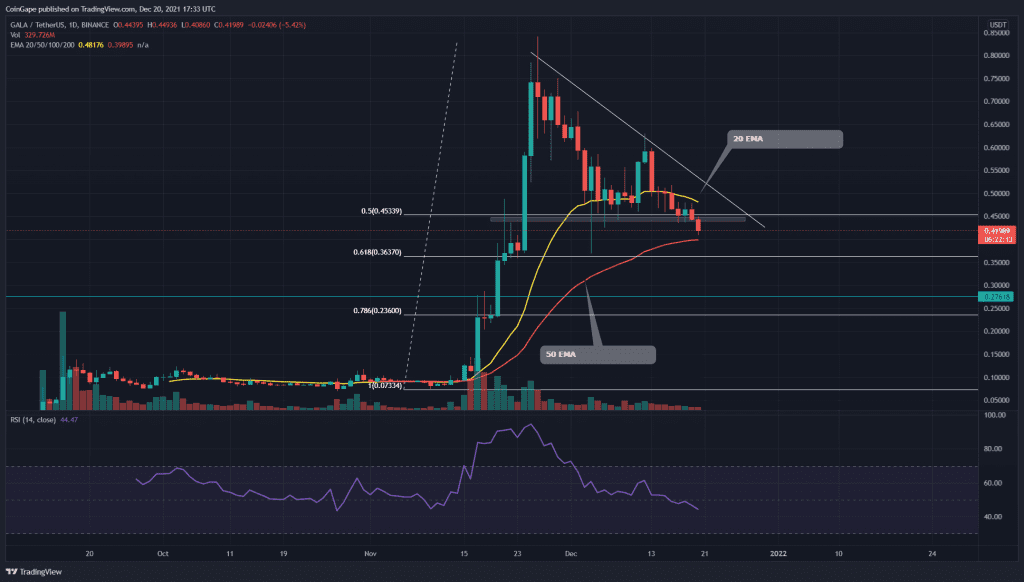
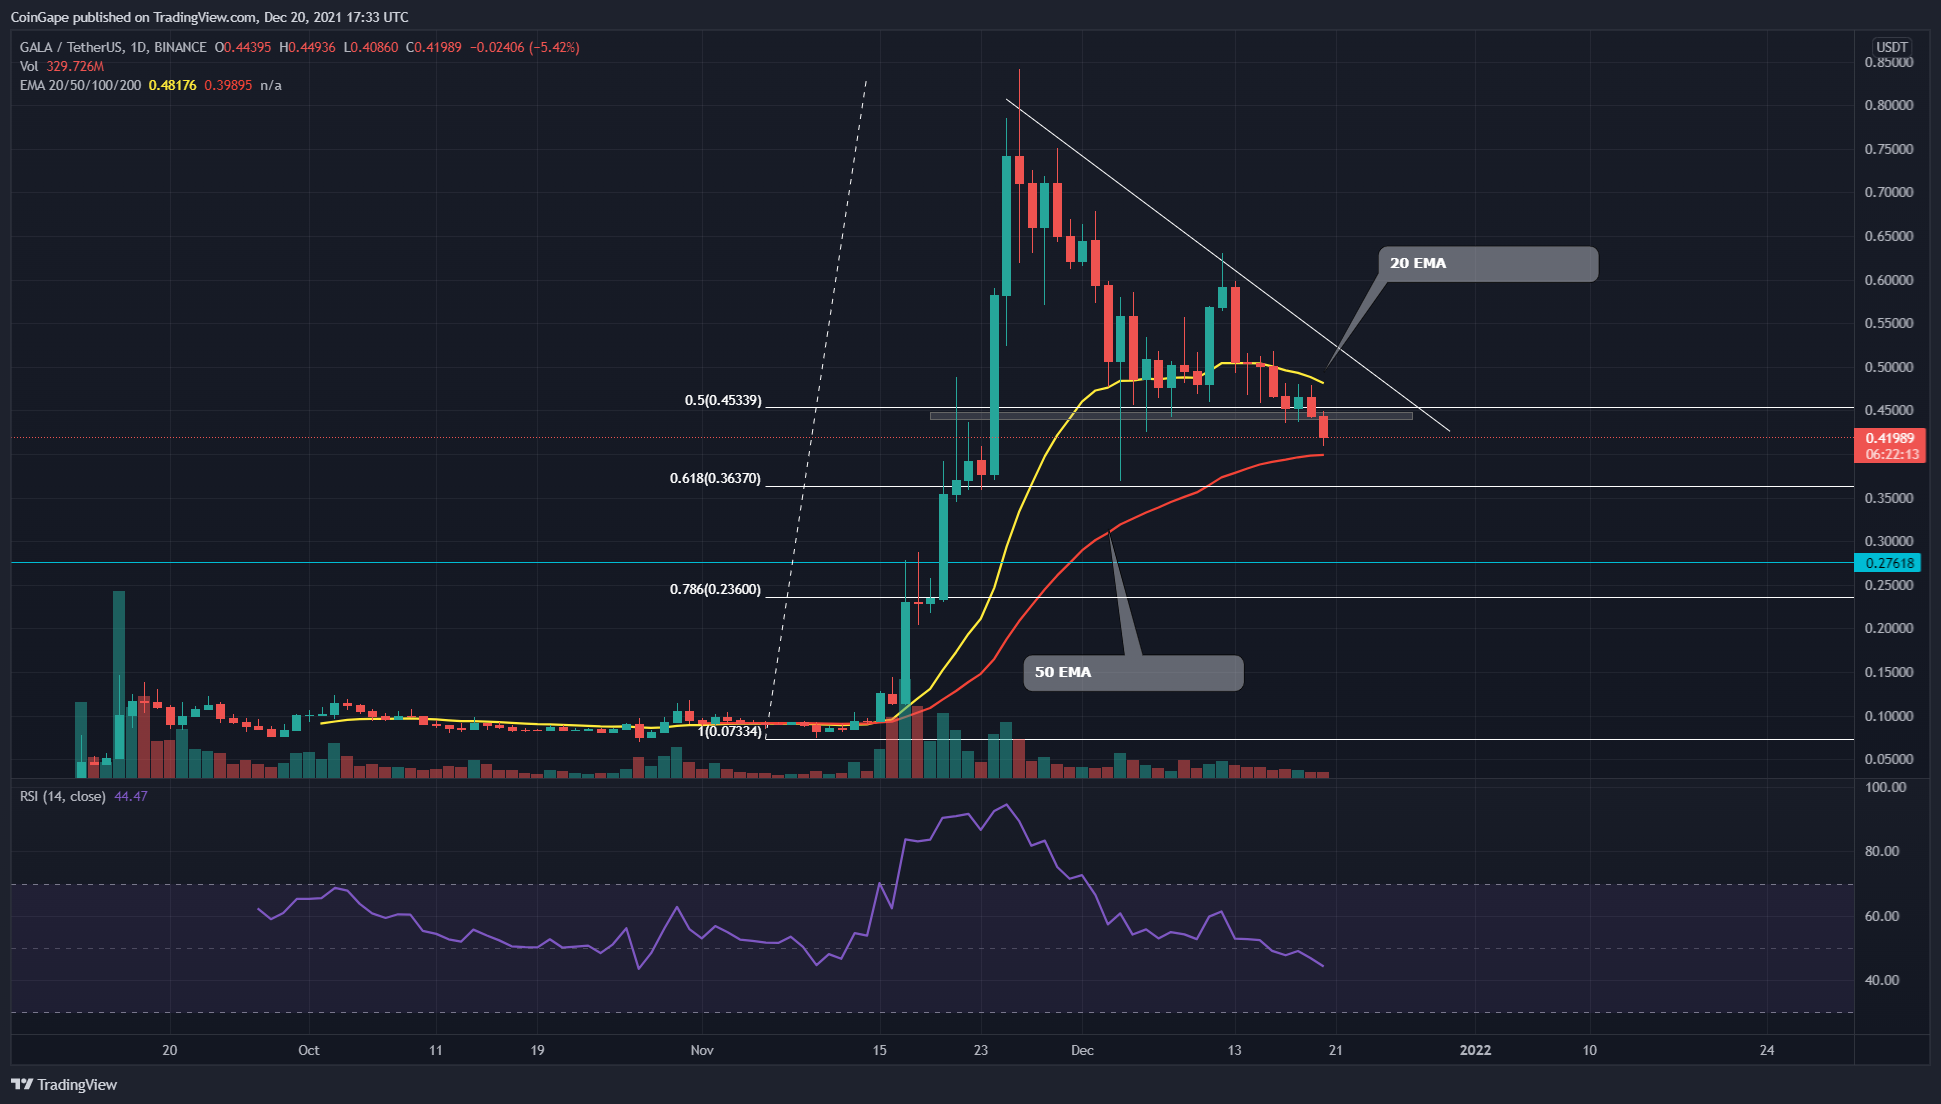
The last time when we covered an article on GALA/USD, the token price was still hovering above the 0.5 Fibonacci retracement level($0.44), trying to obtain sufficient support from it. On December 11th, the price tried to bounce back from this support with a bullish engulfing candle but failed to cross the $0.615 resistance.
The token price was rejected from this level with an evening star candle pattern, dropping this pair back to the $0.44 support. Anyhow this whole structure revealed a descending triangle pattern, suggesting a further fall in its price.
The daily Relative Strength Index (44) steadily approaching the oversold zone.
GALA/USD 4-hour time frame chart

Source- Tradingview
Today, the GALA token price broke down the neckline support level of descending triangle pattern. Along with this support, this pair also breached other crucial like 0.5 FIB level and 200 EMA, indicating a significant loss for the market bulls.
Today, the GALA token price broke down the neckline support level of descending triangle pattern. Along with this support, this pair also breached other crucial like 0.5 FIB level and 200 EMA, indicating a significant loss for the market bulls.
The GALA token price has recently plummeted below the crucial EMAs (20, 50, 100, and 200), indicating a bearish trend. Moreover, the chart also shows a bearish crossover the 20 and 100, encouraging even more sellers in the market.
The Moving average convergence divergence shows the MACD and signal line moving below the neutral zone (0.00), projecting a bearish momentum in the price.