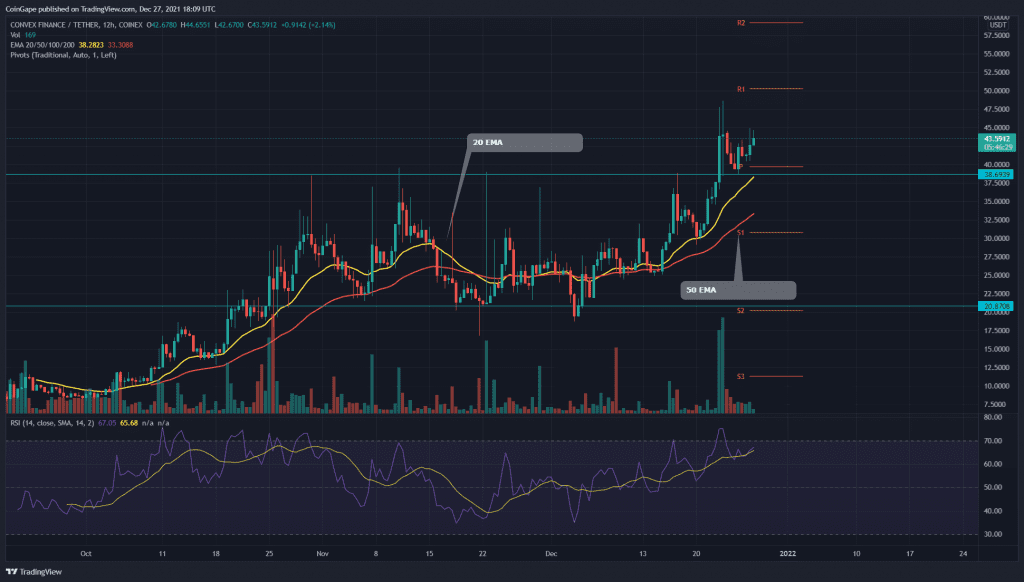
The Convex Finance token has been consolidating in a confined range for more than a month. However, on December 23rd, the listing announcement of this token on the well-known crypto exchange ‘Binance’ brought a ton of new buyers into the market, resulting in a bullish breakout of this range. The crypto trades can grab a good long opportunity if the price sustains this breakout.
Convex/CVX/USD 12-hour Time Frame Chart
 Source-Tradingview
Past Performance or Trend
The CVX token showed a phenomenal rally in October, providing a New-All Time High of the $38.6 mark. However, November brought a minor correction in this token which plunged the token near the $21 support. Since then, the pair resonated between these definite levels forming a range-bound rally.
The RSI Rally Support The Rising Momentum Of CVX Buyers
A consolidating range is usually a resting period for the price where it tries to stabilize the previous rally and prepare for a new one. Once the price gives a proper breakout from either for its extreme levels the price is expected to rally in that direction.
Thus, On December 23rd, the token price provided a decisive breakout from the overhead resistance of $38.6, with the support of massive trading volume. Later the price pulled back to check for sufficient support from this new support.
So far, the pair has shown good sustainability above this level, and the long traders can maintain bullish sentiment until the price holds above the $38.6 mark.
By the press time, the Convex Finance token is trading at 43.5, with an intraday gain of 5.37%. The 24hr volume change is $34.7 Million, indicating a 31.12% hike. According to Coinmarketcap, the token stands at 207th rank with its current market cap of $1.91 billion(+7.6).
Technical Indicators
- -The Relative Strength Index(53) of the 12-hour time chart frame shows a steady upward rally, approaching the overbought territory.
- -The CVX token maintains a bullish sequence among the crucial EMA levels(20, 50, 100, and 200). Moreover, the 20 EMA offers strong support to the token price
- -The traditional pivot shows remarkable confluence with the known chart levels. According to these pivot levels, the crypto traders can expect the nearest resistance at $50.4 followed by $59.2. As for the opposite end, the support levels are $40 and $31.9.