Over the last 24 hours, the crypto industry traded in the red, although some coins had already embarked on a northbound journey. Aave had risen by 9.6% in the last 24 hours, while SushiSwap had logged a gain of 7.1% within the same time frame.
Near-term technicals of both the coins indicated positive price action on their respective charts. Both the coins toppled over their resistance lines and saw the entry of buyers into the market. Aave was trading for $262.94 while SushiSwap was exchanging hands at $10.77.
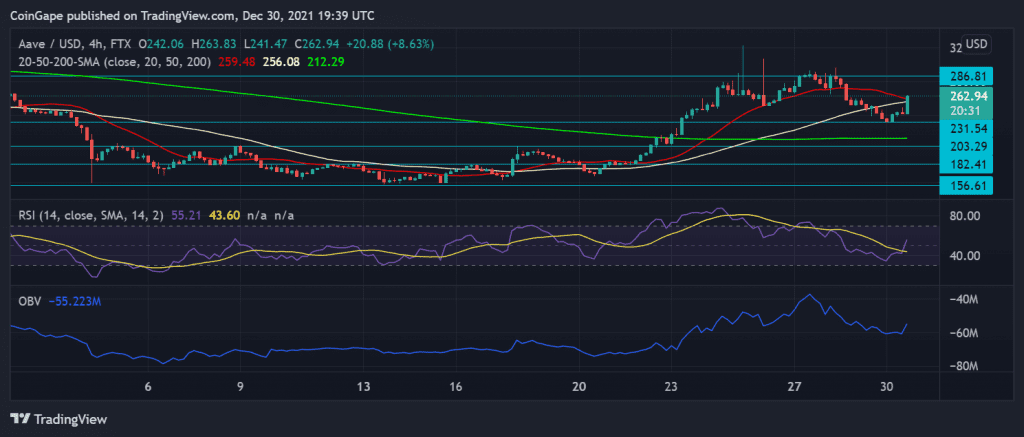
Aave/USD Four Hour Chart

Aave was trading above the support line of $231.54 as it recovered slightly overnight. On the four-hour chart, the coin was placed above the 20-SMA mark, which meant that the buyers were more in number than the sellers in the market.
The coin could target its overhead ceiling at the $286.81 level with a consistent buying strength. Its support level stood at $231.54, falling beneath which the coin could trade close to $203.29. Aave’s price trajectory was bullish ever since December 20; however, the coin also witnessed patches of downward price action, but Aave was quick to recover from that.
The Relative Strength Index noted an uptick which signified increased buying strength as the indicator preferred the bulls. On Balance Volume also chose to side with the bulls as the indicator had shot up, signifying that buyers exceeded sellers in the market.
Sushi/USD Four Hour Chart

SushiSwap had shown impressive growth over the past week and a half. It had recently broken above the $9.91 mark and was seen trading in double digits at the time of writing. The immediate price level in the event of a pullback stood at $7.89.
The overhead price level stood at $10.88, while the other resistance level was at $11.59. Over the last week, Sushi gave 60.8% returns on its ROI, which is quite massive among the returns incurred by the top De-Fi coins.
The Relative Strength Index was hovering near the 75-mark, suggesting excess buying pressure as the asset was overbought at the time of writing. On Balance, Volume was on a steady incline, telling that selling volume was low as buying volume and pressure consistently was picking up. MACD was bullish too, with green histograms after the indicator underwent a bullish crossover.