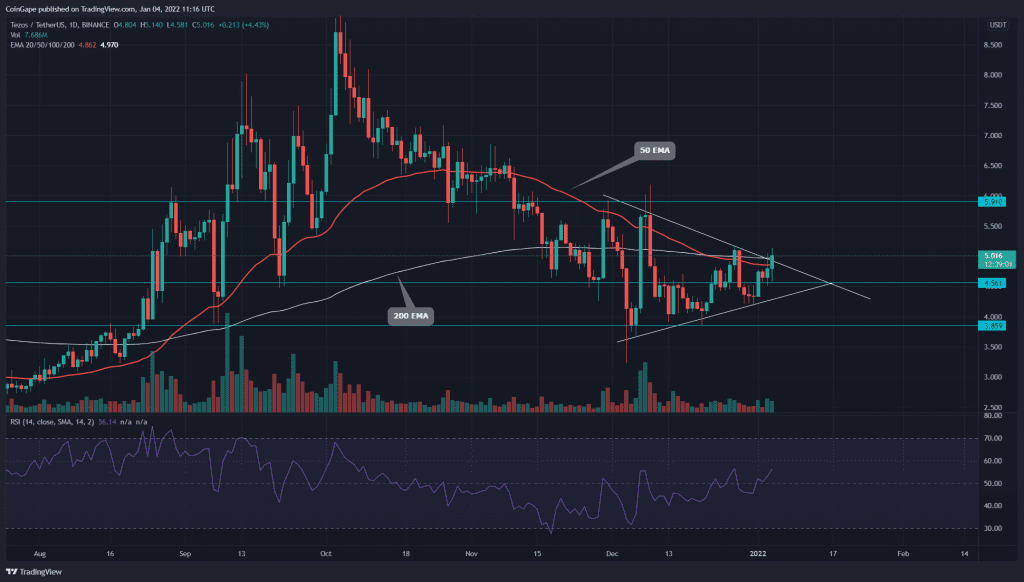
For the past month, the Tezos coin price has been moving in a consolidating rally. This sideways march revealed a symmetrical pattern in the daily time frame chart. The coin price is preparing to escape this pattern with a bullish breakout, suggesting a new rally.
Key technical points:
- The XTZ bulls are trying to reclaim the 200-EMA
- The intraday trading volume in the Tezos coin is $199.7 Million, indicating a 243.5% hike.
 Source- Tradingview
Previously when we covered an article on Tezos, the coin managed to sustain a $4.5 breakout, preparing to initiate a new rally. However, the price couldn’t hold above the 200-EMA($5.1), resulting in another minor pullback.
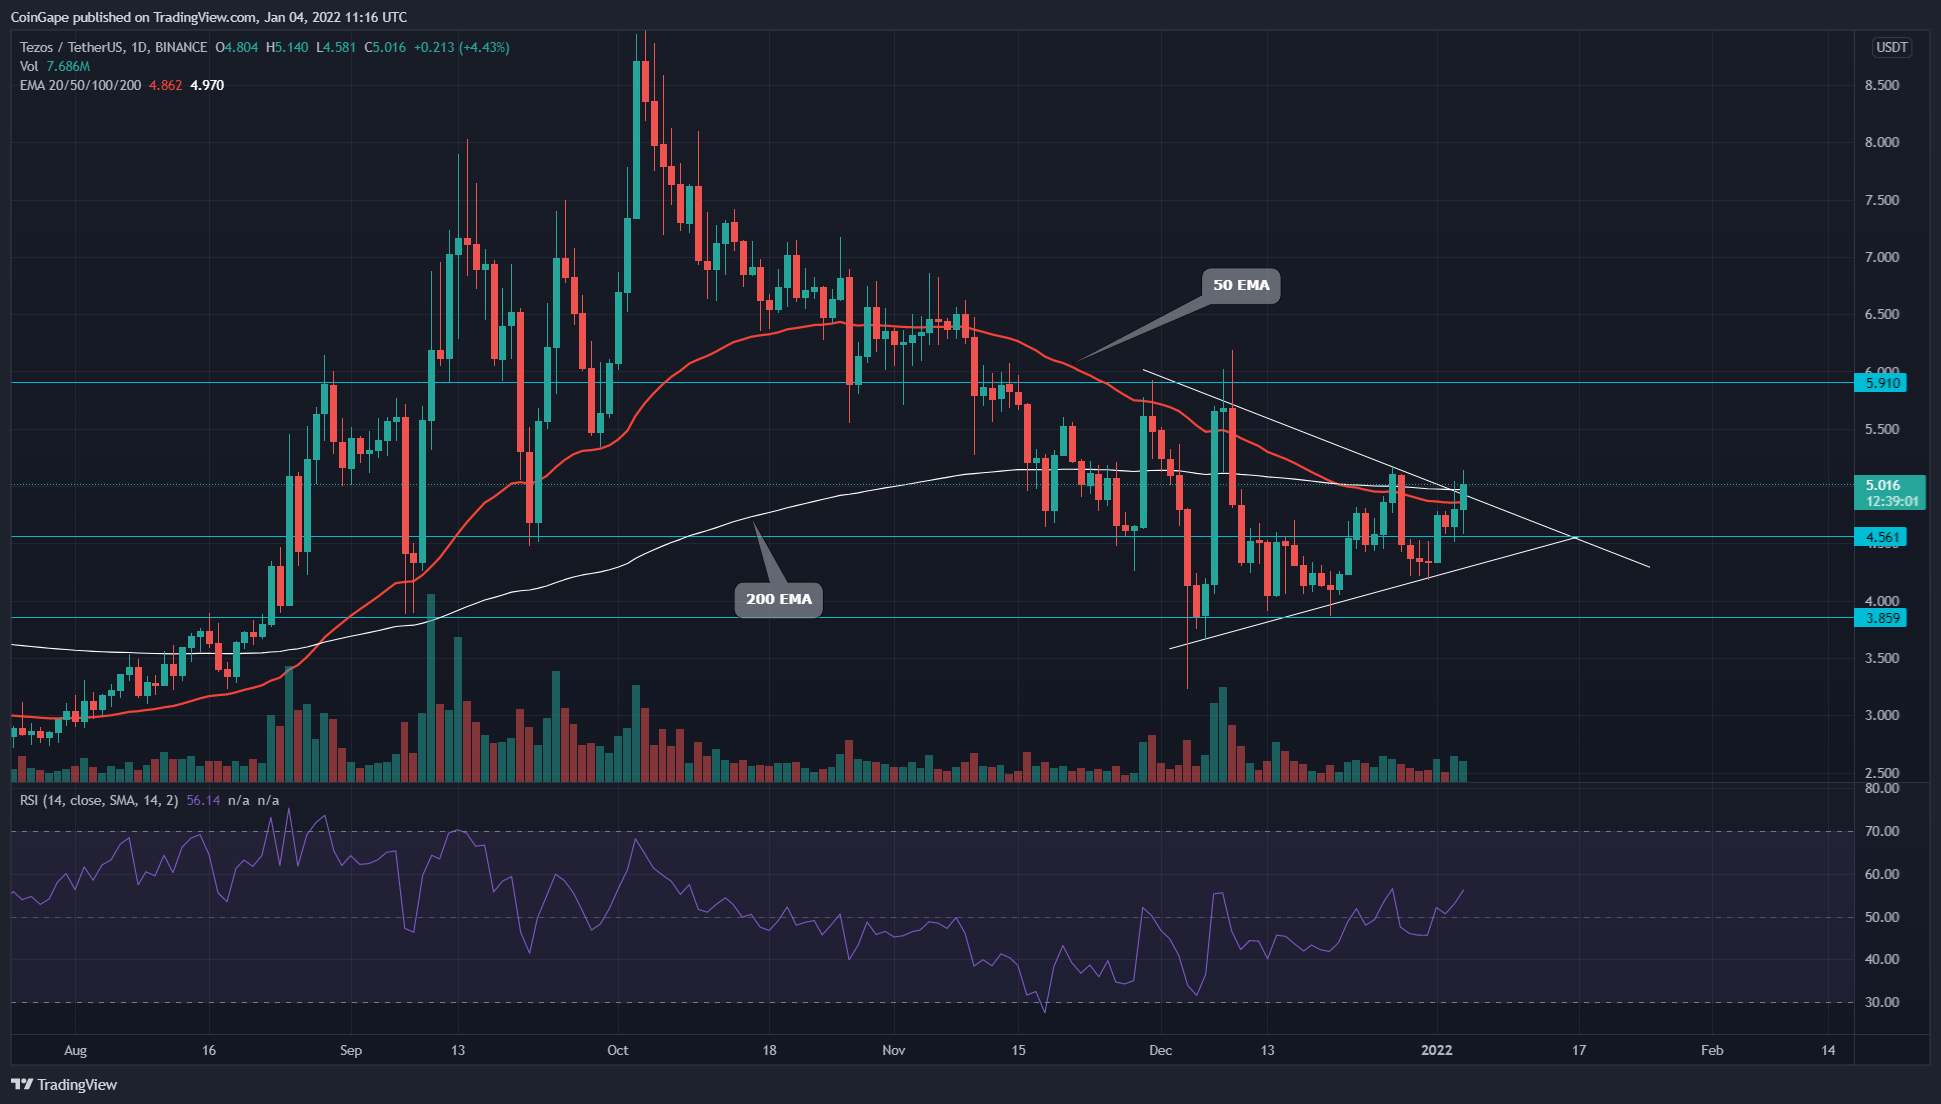
Anyhow, an upcoming support trendline prevents the price from dropping to $3.8 bottom support and instead reveals an excellent trading opportunity for crypto traders in the form of the symmetrical triangle pattern.
The XTZ price at press time is trading at the $5 mark, with an intraday gain of 4.27%. This daily bullish candle is trying to breach the 200-EMA line, providing an excellent edge for the long traders.
The daily Relative Strength Index (62) hops above the neutral zone(0.00), indicating a bullish sentiment for the Tezos coin.
The Support Trendline Carries The Bullish Sentiment For XTZ Investors.

Source- Tradingview
As for now, the XTZ coin is trying to give a bullish breakout from the resistance trendline of the pattern and 200-day EMA simultaneously. However, to confirm a genuine breakout, the crypto traders should wait for a daily candle to close above these resistance levels.
However, in case the price couldn’t sustain this breakout, the long traders can still maintain a bullish sentiment until the price obtains sufficient support from the rising trendline.
The traditional pivot levels indicate the nearest resistance for Tezos coin price at the $5.1 resistance at $5.65, followed by $0.6. As for the opposite end, the support levels are $4.66 and $4.1.