In this article, BeInCrypto takes a look at the seven altcoins that increased the most last week, more specifically from Dec 31 to Jan 7.
These altcoins are:
- Cosmos (ATOM) : 39.10%
- Harmony (ONE) : 34.76%
- Fantom (FTM) : 24.49%
- Chainlink (LINK) : 22.06%
- Ravencoin (RVN) : 19.71%
- Internet Computer (ICP) : 12.45%
- Yearn.Finance (YFI) : 8.26%
ATOM
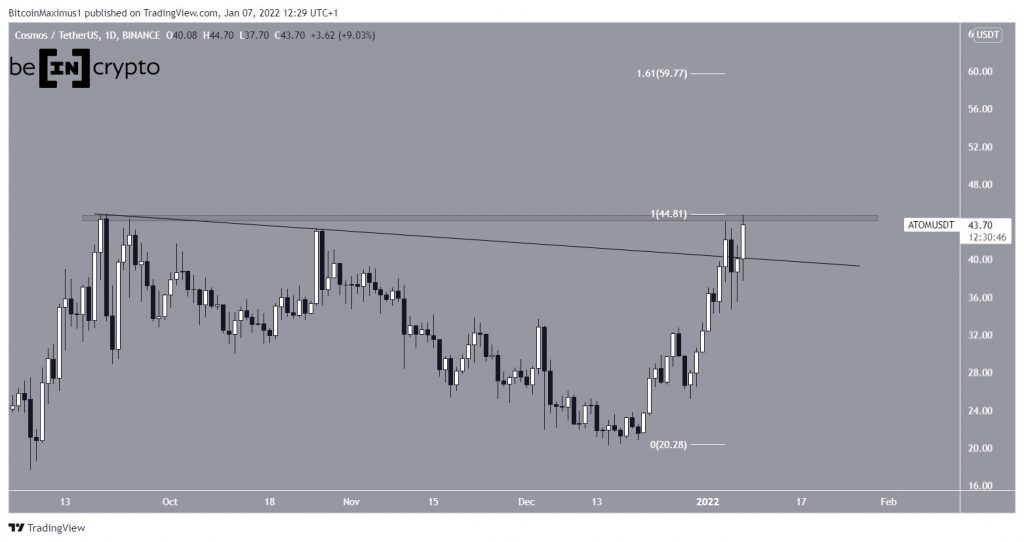
ATOM broke out from a descending resistance line on Jan 4. After the slight drop that ensued, it resumed its upward movement and is making an attempt at breaking out from the $44.5 resistance area. This is the final resistance area prior to a new all-time high price.
ATOM seems likely to continue increasing and eventually reach a new all-time high price.
If successful, the next closest resistance area would be at $59.77, created by the 1.61 external Fib retracement resistance level.

ONE
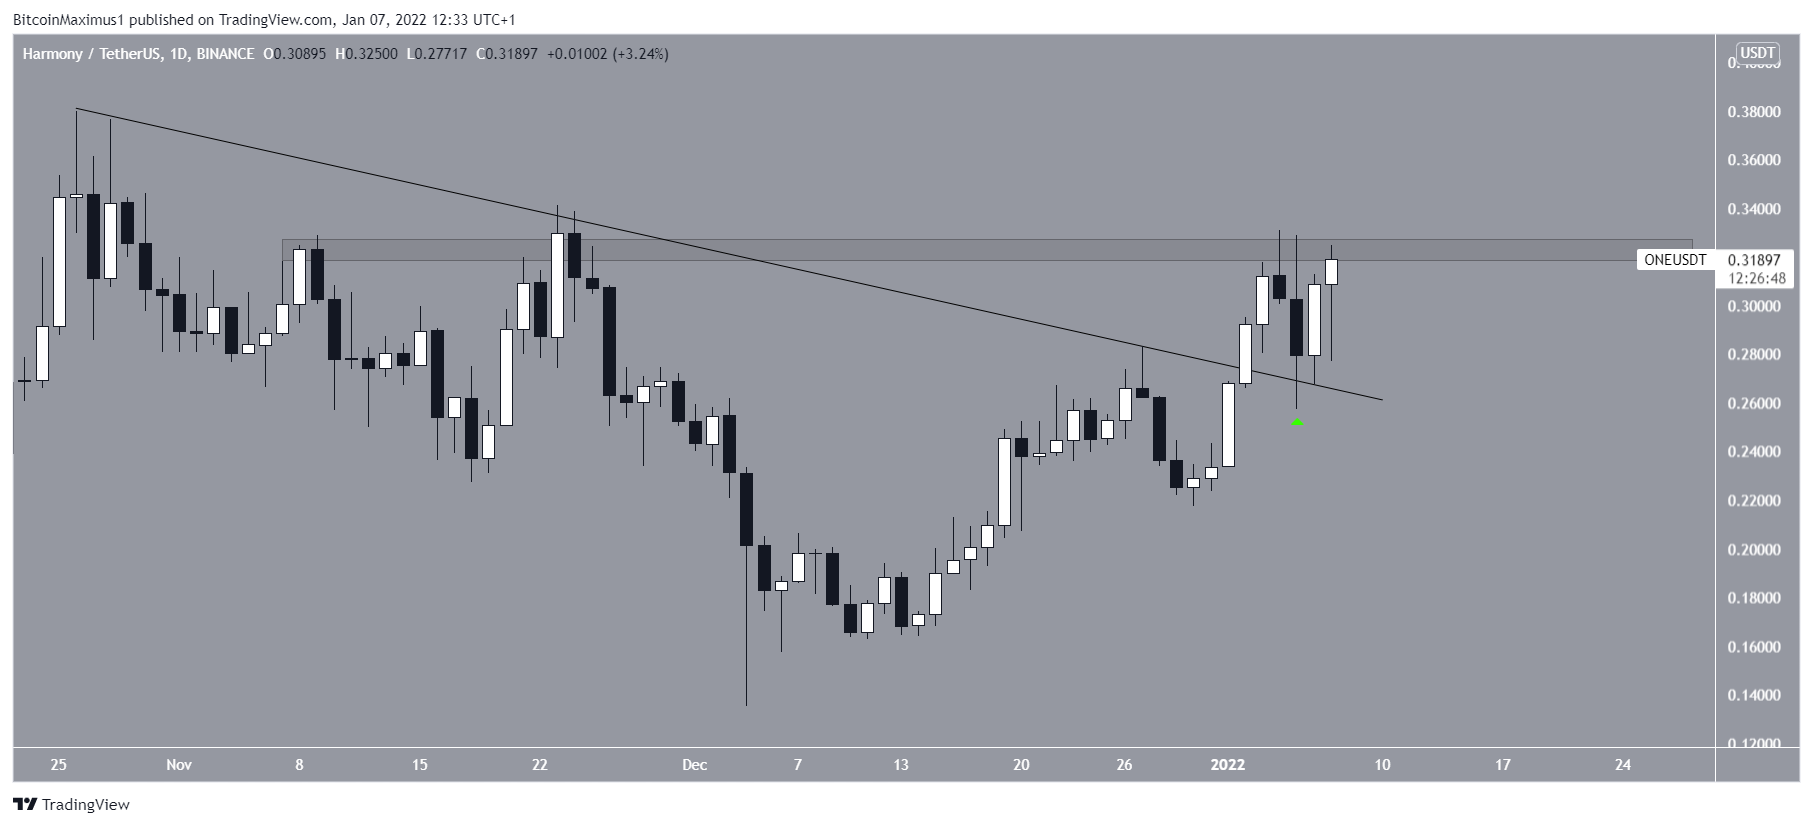
Similarly to ATOM, ONE broke out from a descending resistance line on Jan 2. It returned to validate it as support two days later (green icon) and then initiated another upward movement.
Currently, the token is attempting to break out from the $0.32 horizontal resistance area. If successful, it would be expected to increase towards the $0.38 all-time high price.

FTM
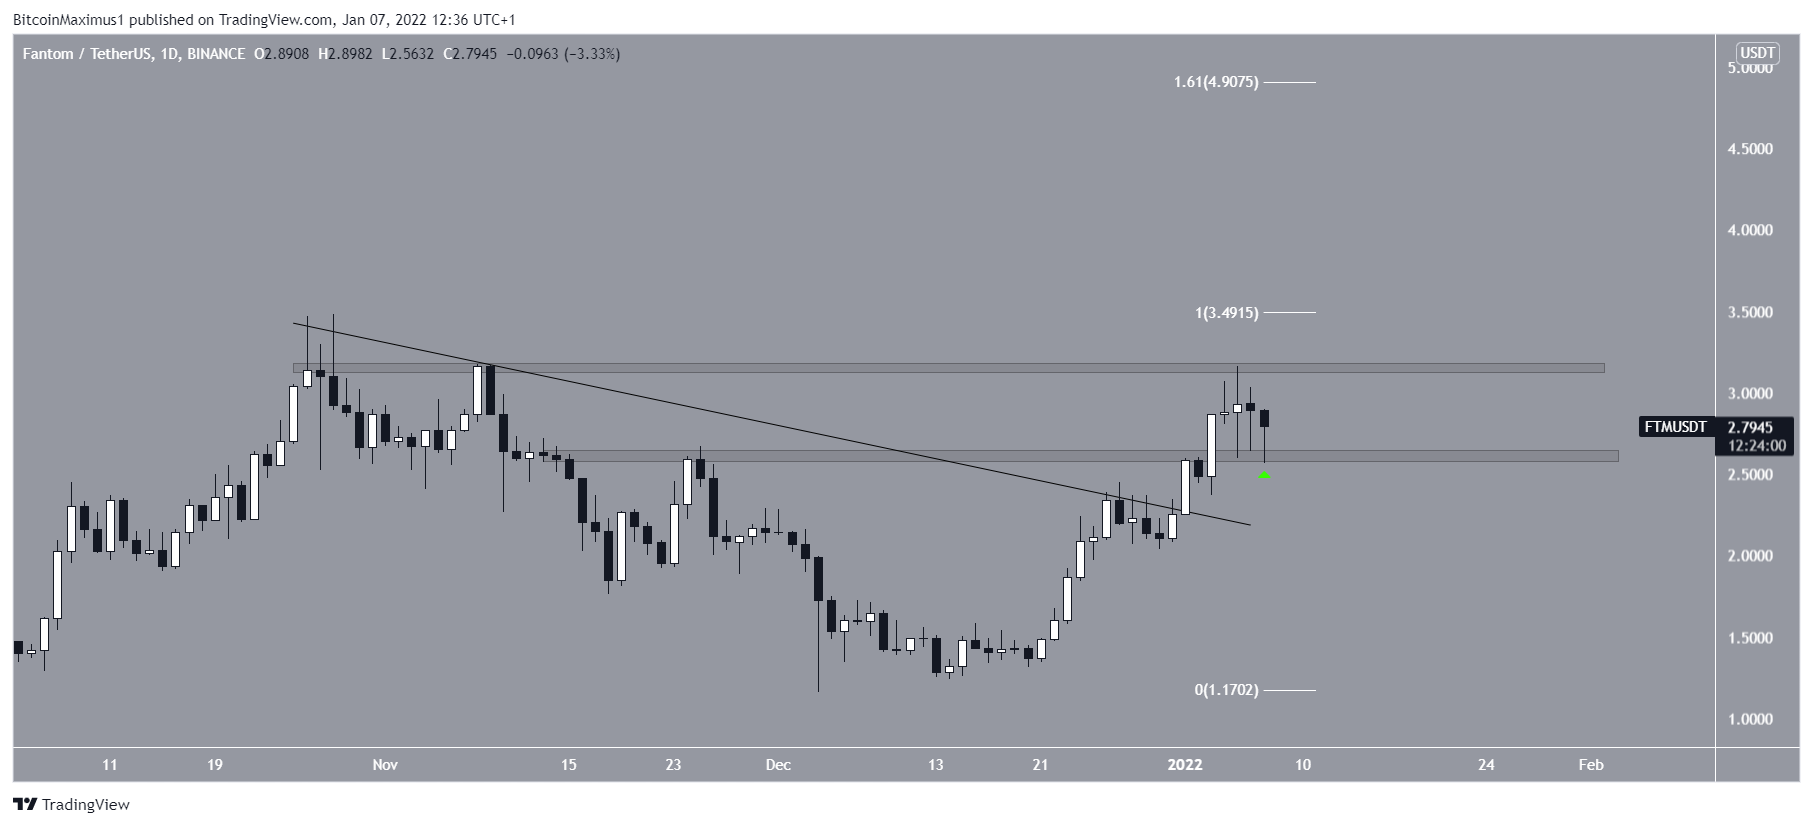
FTM also broke out from a descending resistance line on Jan 1. Unlike ATOM and ONE, it did not return to validate the line as support, rather continued to increase until it reached a high of $3.16 on Jan 5.
The token dropped afterwards and validated the $2.6 area as support (green icon).
If the upward movement continues and FTM reaches a new all-time high price, the next resistance area would be at $4.90, created by the 1.61 external Fib retracement resistance level.
LINK
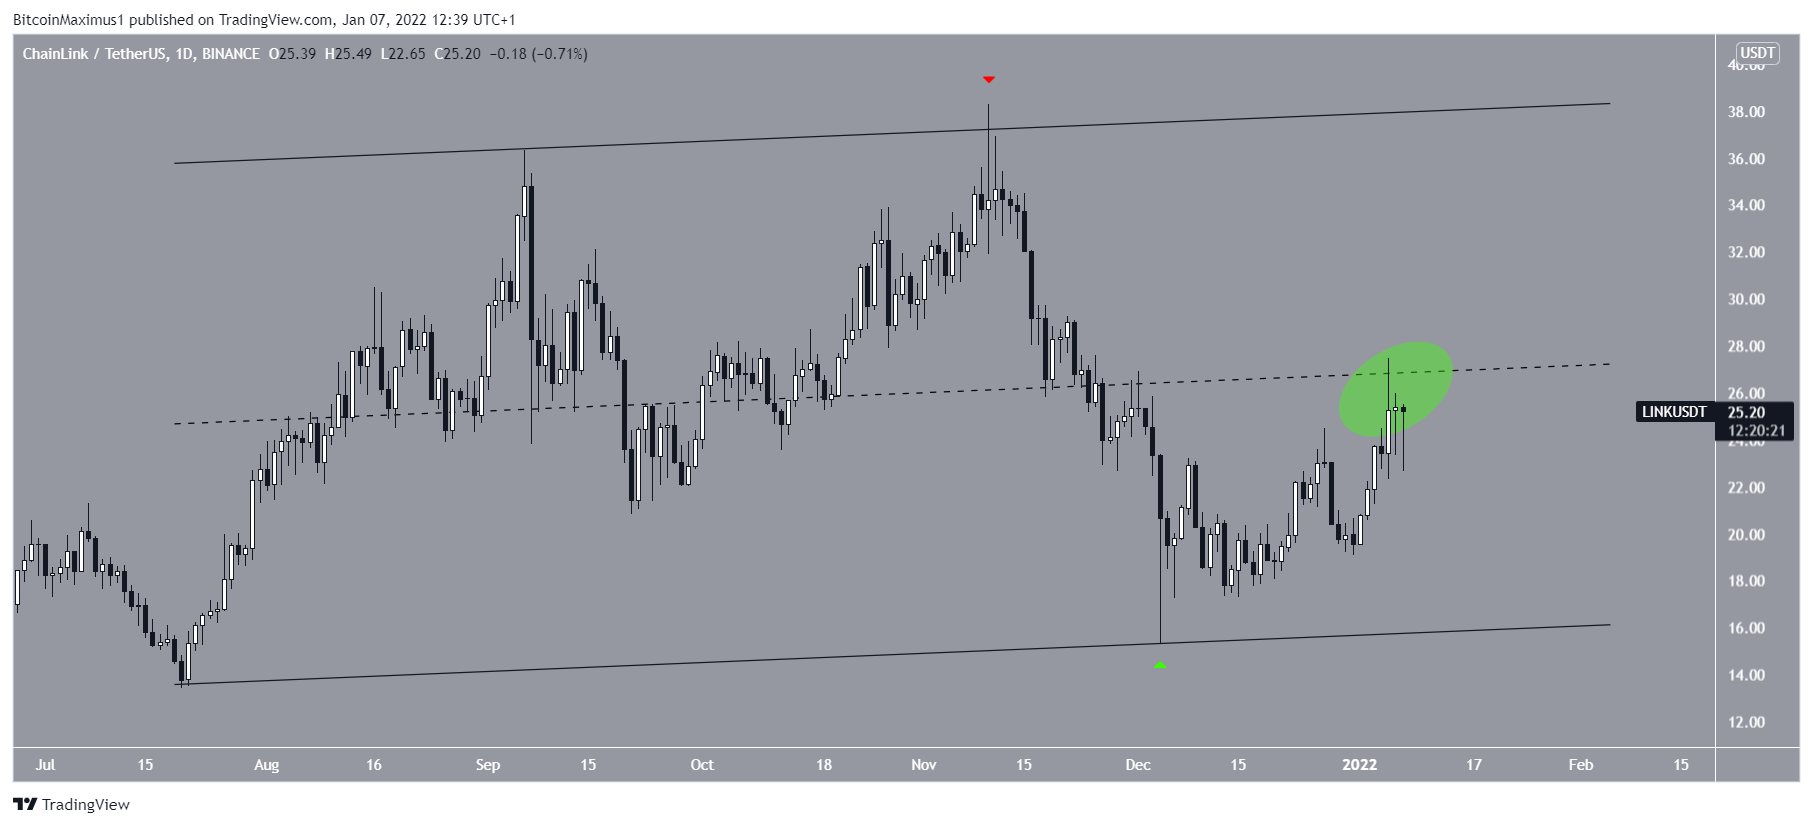
LINK has been decreasing since Nov 10 (Red icon), when it validated the resistance line of an ascending parallel channel. The decrease continued until Dec 14, culminating with a low of $15.3 (green icon). The ensuing bounce served to validate the support line of the same channel.
Currently, LINK is trading very close to the middle of the pattern. Whether it managed to reclaim the midline (green circle) or falls down to the support line once more will likely determine the direction of the future trend.
RVN
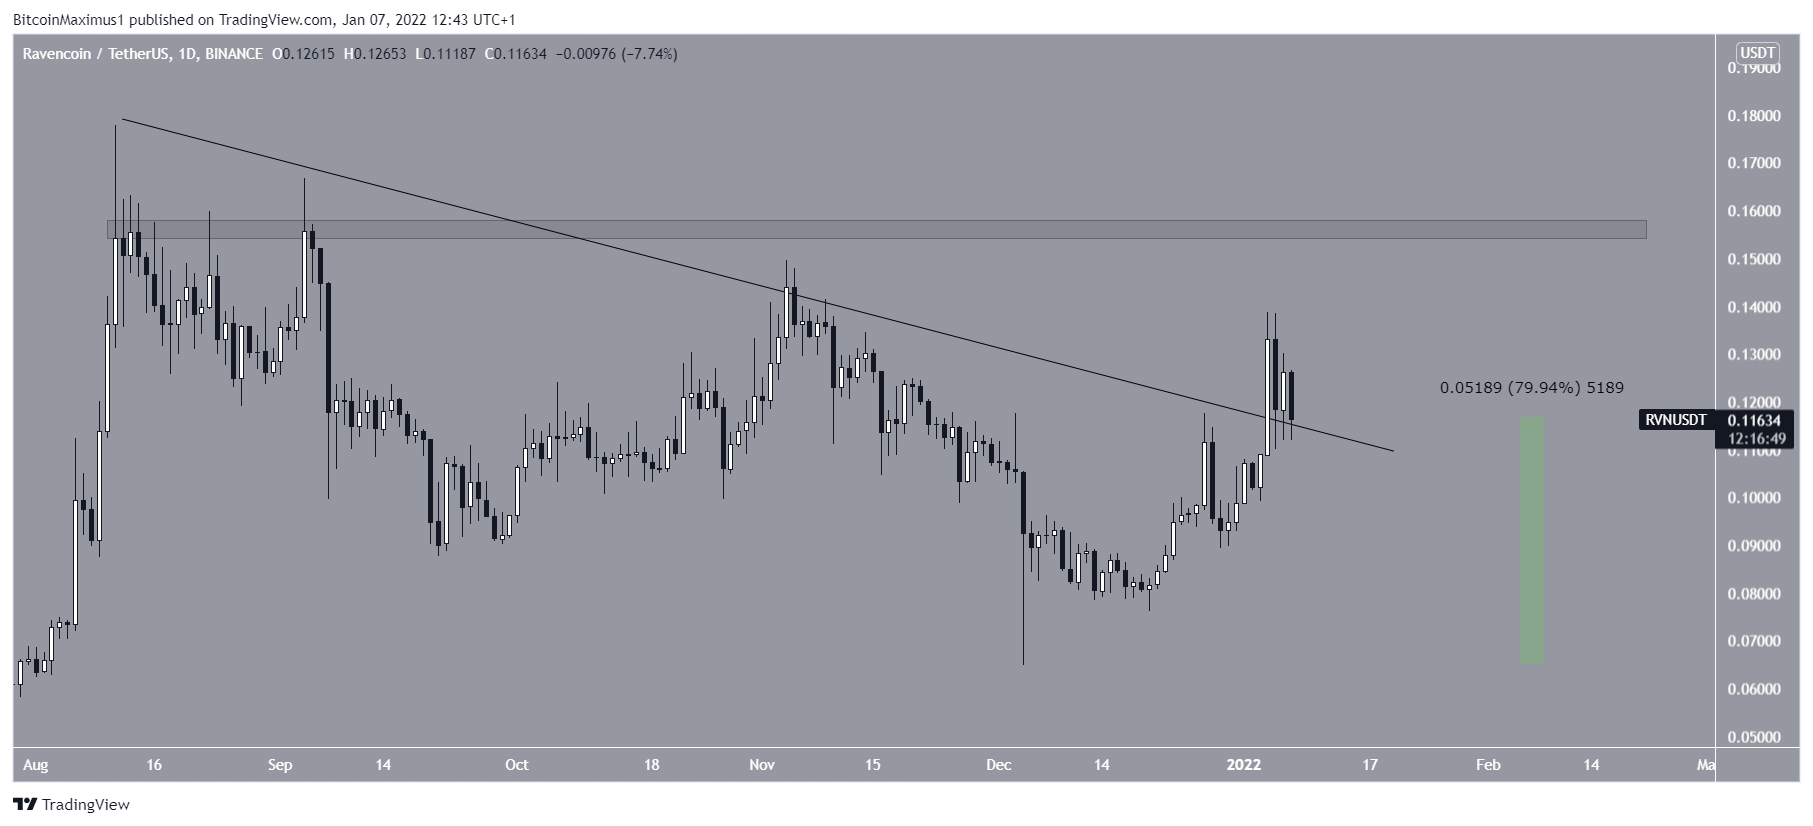
On Jan 4, RVN broke out from a descending resistance line that had been in place since Aug 11. This confirmed that the short-term correction was complete.
Afterwards, the token validated the line as support (green icon) and has been moving upwards since. Measuring from the Dec 4 lows, the token has increased by 80%.
The main resistance area is at $0.156, created by the Aug highs. A movement above this level would greatly accelerate the rate of increase.
ICP
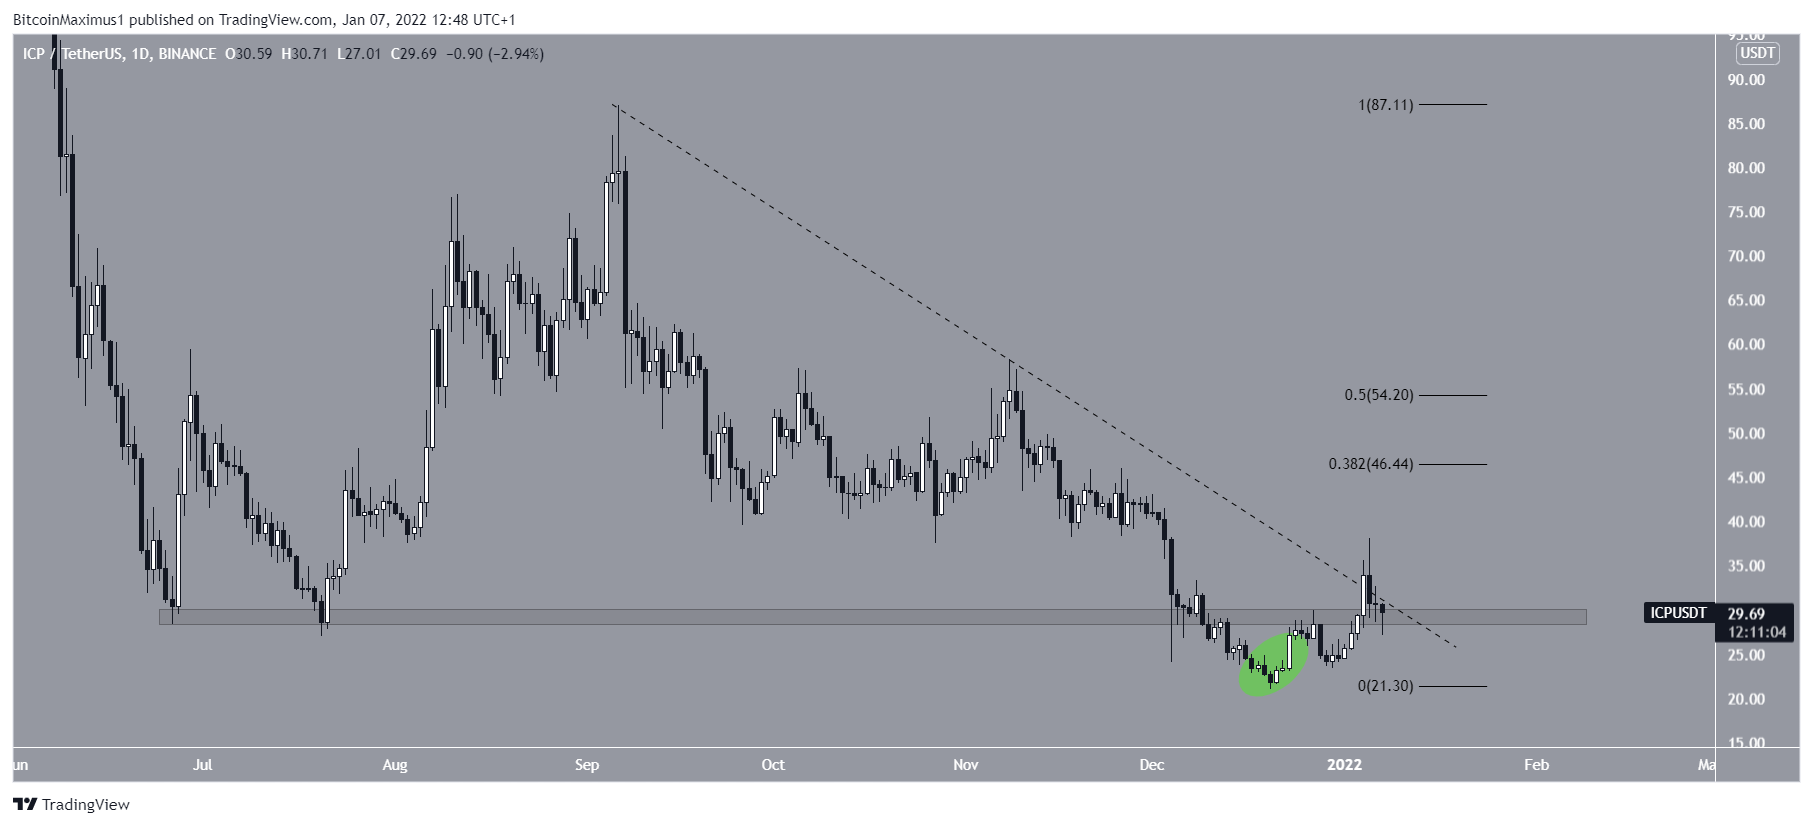
In December (green circle), ICP purportedly broke down from the $29.50 horizontal support area. The area had been in place since July.
However, the token regained its footing and initiated an upward movement on Jan 1, making a breakout attempt on Jan 5.
Despite this, ICP was rejected by a descending resistance line. If it breaks out, the closest resistances would be between $46.5 – $54.2.
YFI
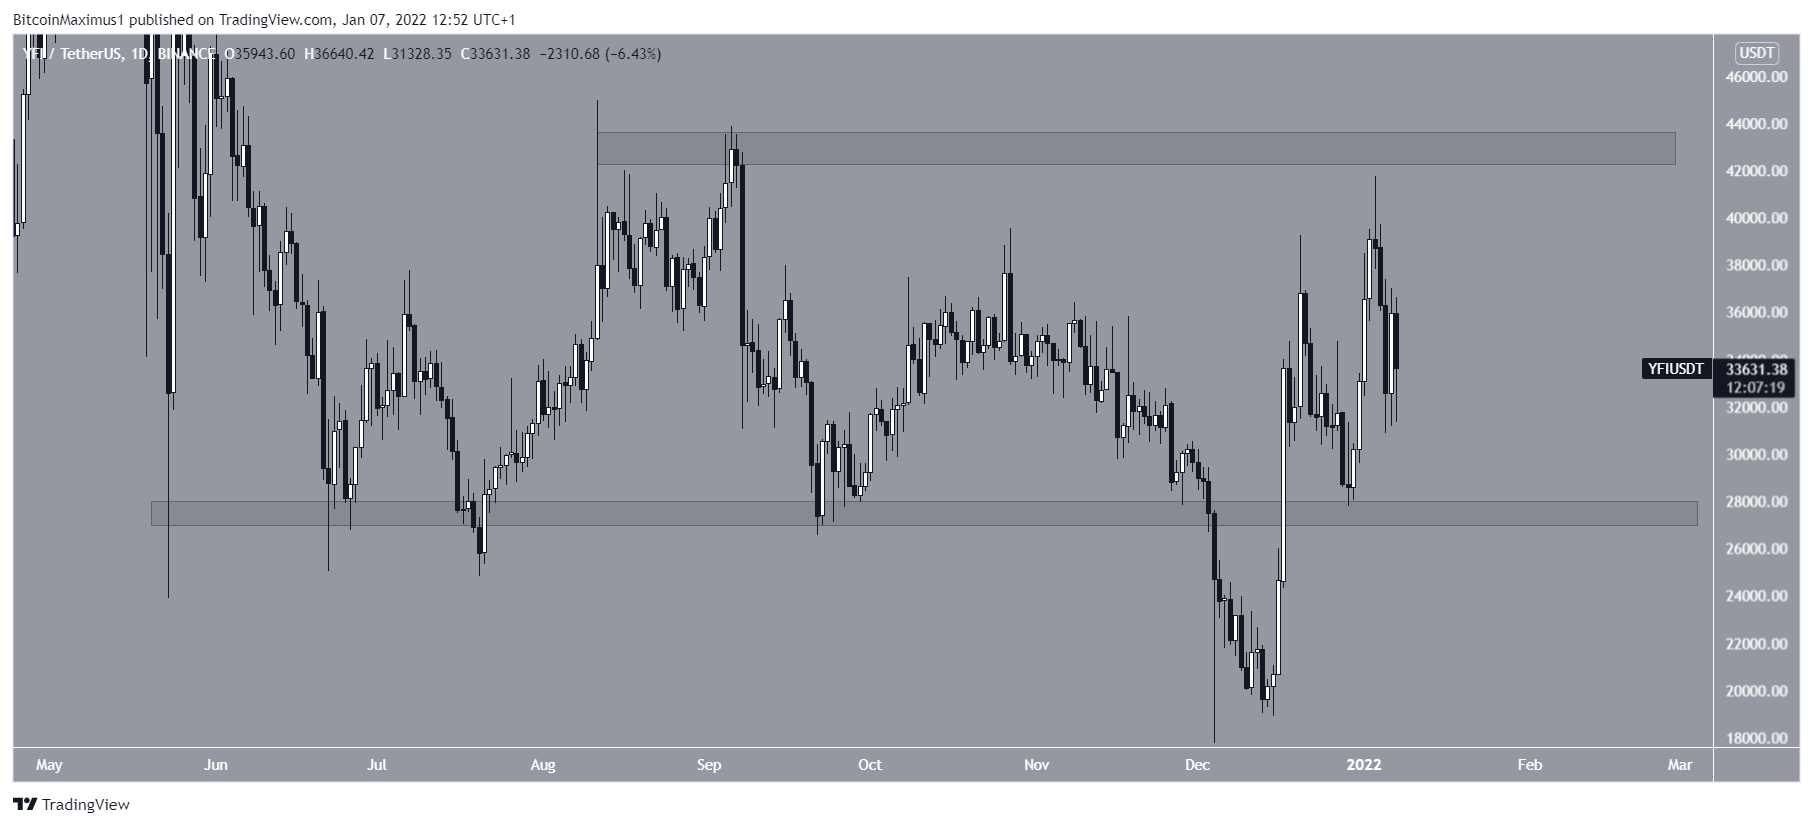
Similarly to ICP, YFI broke down from the $27,500 horizontal support area on Dec 4. However, it initiated an upward movement and reclaimed the area on Dec 17.
Currently, it is trading in a range between $27,500 – $42,300. A movement above the resistance area could accelerate the rate of increase.
For BeInCrypto’s latest Bitcoin (BTC) analysis, click here.
Disclaimer
All the information contained on our website is published in good faith and for general information purposes only. Any action the reader takes upon the information found on our website is strictly at their own risk.