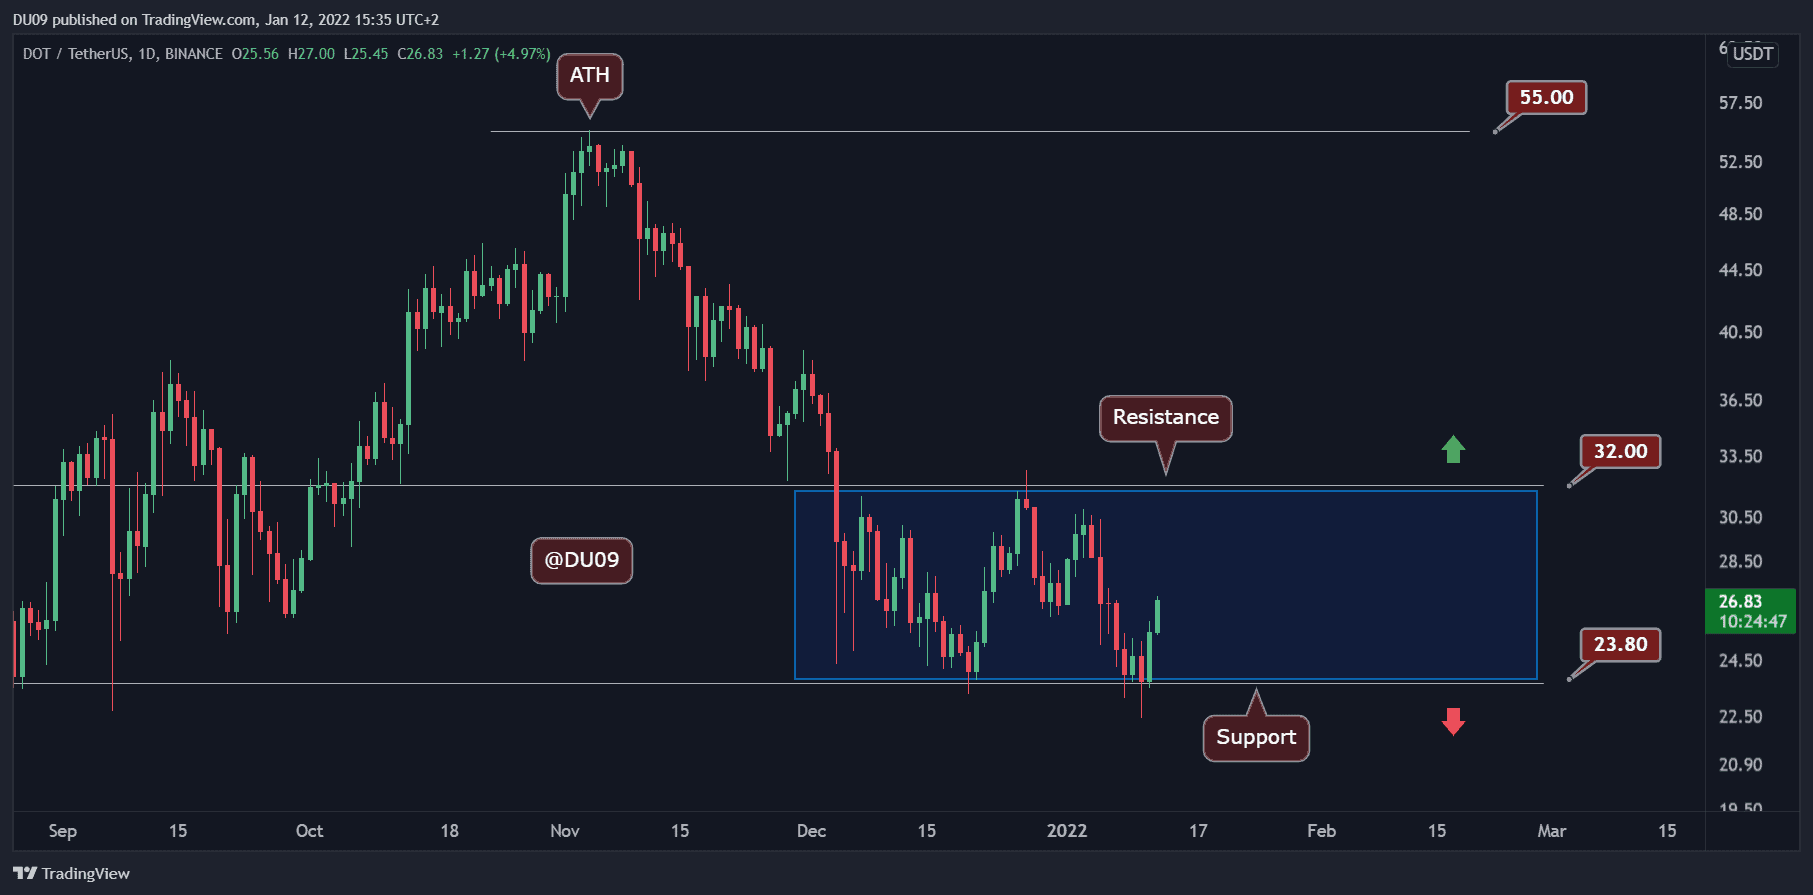
Key Support level: $23
Key Resistance level: $32
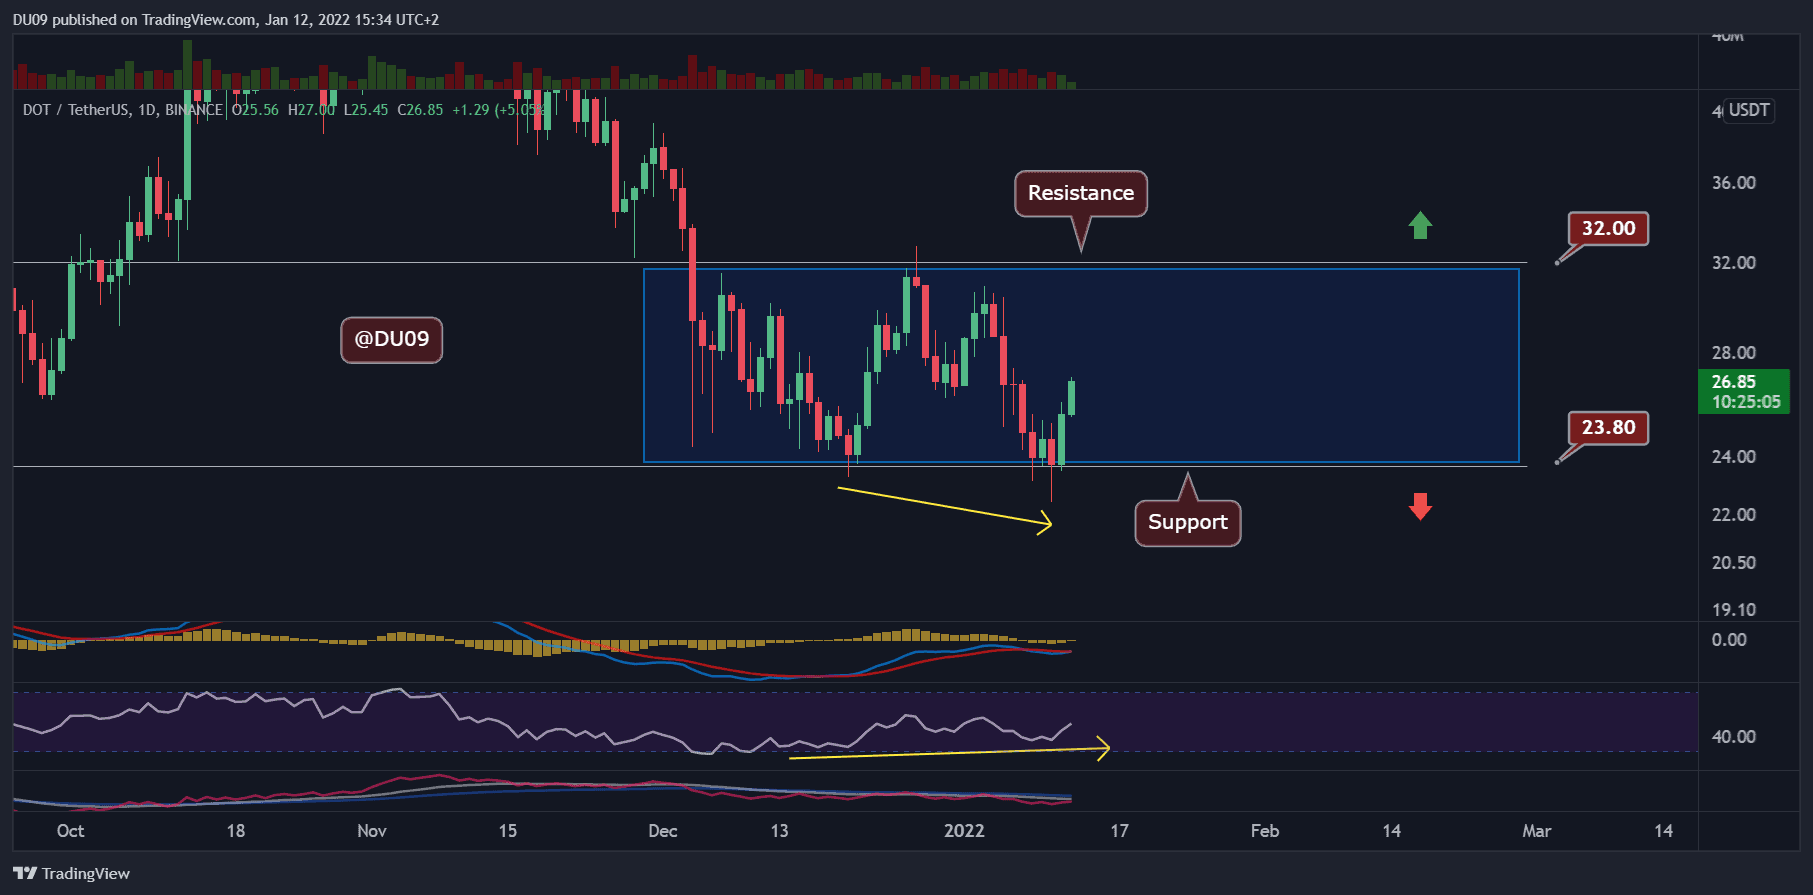
Polkadot briefly fell under $23, but it’s been up only ever since. Throughout the recovery, the RSI has formed a large bullish divergence compared to the low on December 20th. This has turned the momentum bullish for DOT, which is now moving quickly towards the key resistance at $32.
Technical Indicators
Trading Volume: This current move higher is on good volume, but nothing is out of the ordinary, looking at the past weeks.
RSI: The daily RSI made a clear bullish divergence as indicated on the chart below by the yellow arrows. This was a signal for buyers that it was time to pay attention to DOT, and the price is now showing it.
MACD: The daily MACD is a day away from a bullish cross. This is good news for the bulls as DOT may enter into a sustained rally, at least until it faces the key resistance at $32.
Bias
The bias on DOT is currently bullish. The indicators support this bias, as stated above.
Short-Term Prediction for DOT Price
DOT is on a mission, and the price may soon reach the key resistance at $32. Of course, the overall market momentum is an important thing to keep in proper consideration.
Binance Free $100 (Exclusive): Use this link to register and receive $100 free and 10% off fees on Binance Futures first month (terms).
PrimeXBT Special Offer: Use this link to register & enter POTATO50 code to get 25% off trading fees.
Disclaimer: Information found on CryptoPotato is those of writers quoted. It does not represent the opinions of CryptoPotato on whether to buy, sell, or hold any investments. You are advised to conduct your own research before making any investment decisions. Use provided information at your own risk. See Disclaimer for more information.
Cryptocurrency charts by TradingView.