On-chain data suggests there may have been a strong correlation between the Bitfinex Reserve and the Bitcoin price during the crash to $35k.
Bitfinex Reserves Rose Sharply As BTC Price Plunged Down To $35k
As pointed out by an an analyst in a CryptoQuant post, the movement in the Bitfinex reserve seems to have had an impact on the Bitcoin price recently.
The relevant on-chain indicator here is the “derivatives exchange reserve,” which measures the total amount of BTC held in wallets of a derivatives exchange.
The exchange in focus here is Bitfinex so the metric is called “Bitfinex Reserve.” When the value of this indicator rises, it means more coins are being deposited to the exchange. Such a trend may be bearish as the supply of Bitcoin on exchanges usually indicates the selling supply.
On the other hand, when the reserve’s value moves down, it means investors are transferring their coins out of the exchange. This kind of trend is usually bullish as it implies the sell supply is going down.
Related Reading | First Bitcoin Mag And Now LaBitConf? Why Does YouTube Keep Closing BTC Channels?
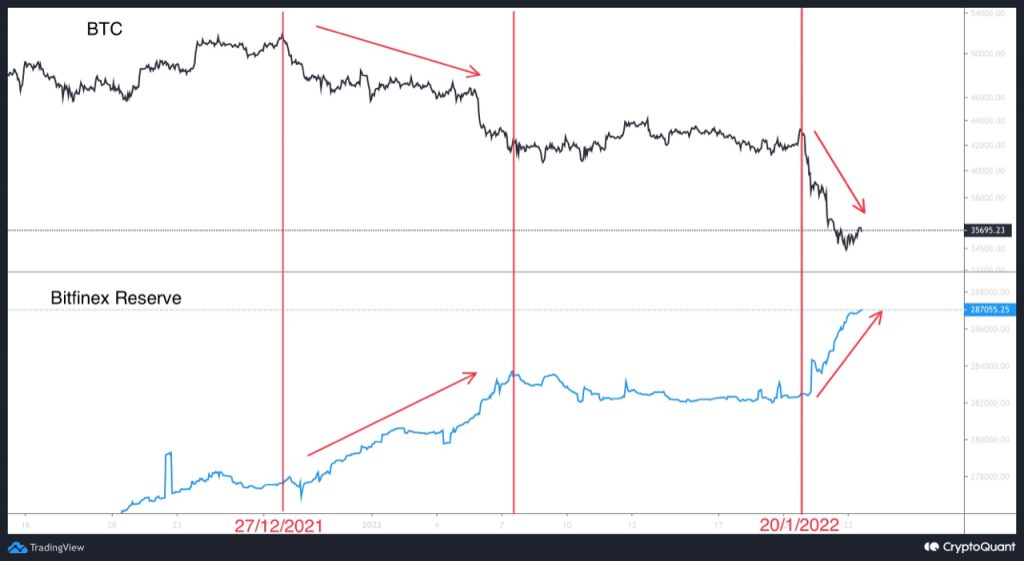
Now, here is a chart that compares the trends of the Bitfinex reserve and the BTC price over the past month:
Looks like the value of the reserve has risen sharply recently | Source: CryptoQuant
As you can see in the above graph, there seems to be a correlation between the Bitfinex reserve and the Bitcoin price over this period.
On 27 Dec, the exchange’s reserve showed a gradual uptrend that lasted for about a couple of weeks. At the same time, the price of the crypto fell down with a similarly gradual trend.
Related Reading | NYC Mayor Will Keep His Promise And Convert First Paycheck To Bitcoin And Ethereum
After that, both the price and the reserve moved sideways for a while. But on 20 Jan, the Bitfinex reserve had a sharp spike up, while the price of BTC plunged down.
The quant believes that this trend may suggest that the movement in Bitfinex reserve could have been behind the crash in the price of the coin to $35k.
Bitcoin Price
At the time of writing, Bitcoin’s price floats around $33.8k, down 21% in the last seven days. Over the past month, BTC has lost 33% in value.
The below chart shows the trend in the price of the crypto over the last five days.

BTC's price seems to have further plunged down in the last 24 hours | Source: BTCUSD on TradingView
Since the crash, Bitcoin hasn’t shown any significant recovery. Rather, the price seems to be further going down still. At the moment, it’s unclear when a bottom may be hit.
Featured image from Unsplash.com, charts from TradingView.com, CryptoQuant.com