Disclaimer: The findings of the following analysis are the sole opinions of the writer and should not be considered investment advice
A little more than a week ago, the price of Binance Coin crashed straight through the $417 and $413 support levels but found some demand at the $343 level. This buying pressure has slowly built in recent days and the price of Binance Coin has seen some gains at the same time. However, the near-term outlook for Binance Coin was not yet bullish. Binance continues to remain one of the largest exchanges blockchain infrastructure providers.
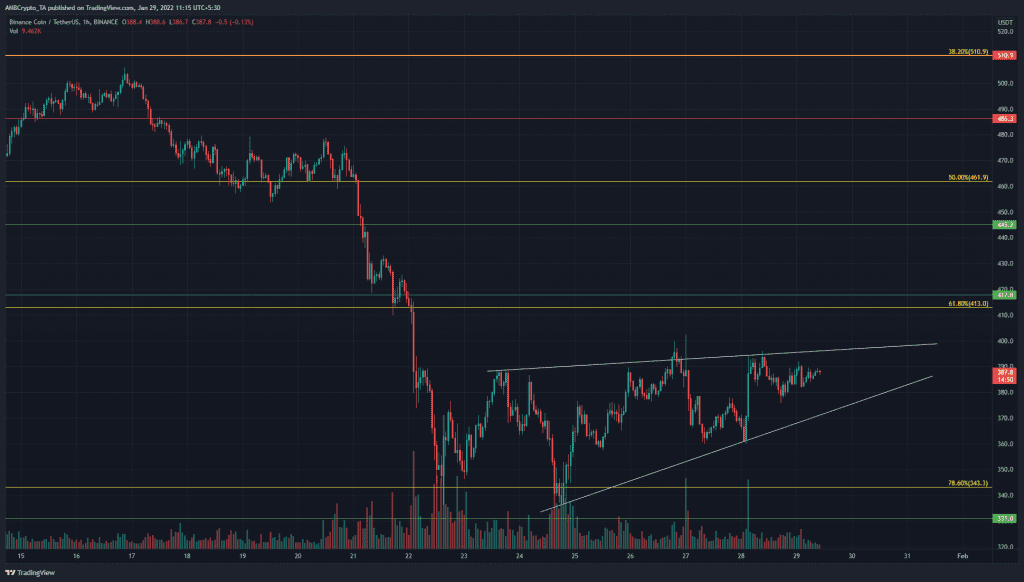
Source: BNB/USDT on TradingView
The Fibonacci retracement lines (yellow) were plotted for BNB’s rise from $254.5 to $669.3 in 2021. At the time of writing, the price has bounced almost exactly off the 78.6% retracement level.
The entire pocket from 61.8% to 78.6% retracement level is an area where investors seek to buy a retracement on an asset in anticipation of a run back toward and beyond the previous highs. This could well materialize in the months to come for BNB. Yet, Bitcoin approached an area of resistance at $38.5k, and a rejection could see BNB shed all the gains it posted in the past week.
The price formed an ascending wedge pattern (white), a bearish pattern that, upon a session close beneath the pattern, can see the price plunge quickly back to $343. In the context of BTC (resistance at $38.5k, trading at $37.6k at the time of writing) and BNB (resistance at $400-$415, trading at $387 at press time) a move into this liquidity pocket can tease buyers into thinking a pump is incoming, while sell orders were more likely to flood the order book.
Rationale

Source: BNB/USDT on TradingView
The MACD and the Awesome Oscillator climbed above the zero line to show some bullish momentum in recent days but they were unable to form a higher high. If the price climbed higher, while the indicators don’t make a higher high, a bearish divergence will develop, which can be used to sell the asset.
The Cumulative Delta Volume indicator showed that there has been steady buying since $343 for BNB.
Conclusion
There was some liquidity at the $400 area which the price could seek, and sellers could force the market in the opposite direction once enough buyers have been tricked into thinking the market structure has flipped bullish. This was a scenario that was likely to play out, as weekends have lower liquidity and the near-term market structure for Binance Coin did not seem to encourage strongly bullish price action.