Since the correction phase initiated in October end of 2021, the SHIB price has only experienced a steady downtrend. The token price has tumbled by 75% from the All-Time High of $0.00008455, and current hints further sell-off respecting a falling channel pattern. However, the Shibarmy should be excited as Shiba Inu is prepared to launch its Metaverse-‘Shiberse’ in 2022.
Key technical points:
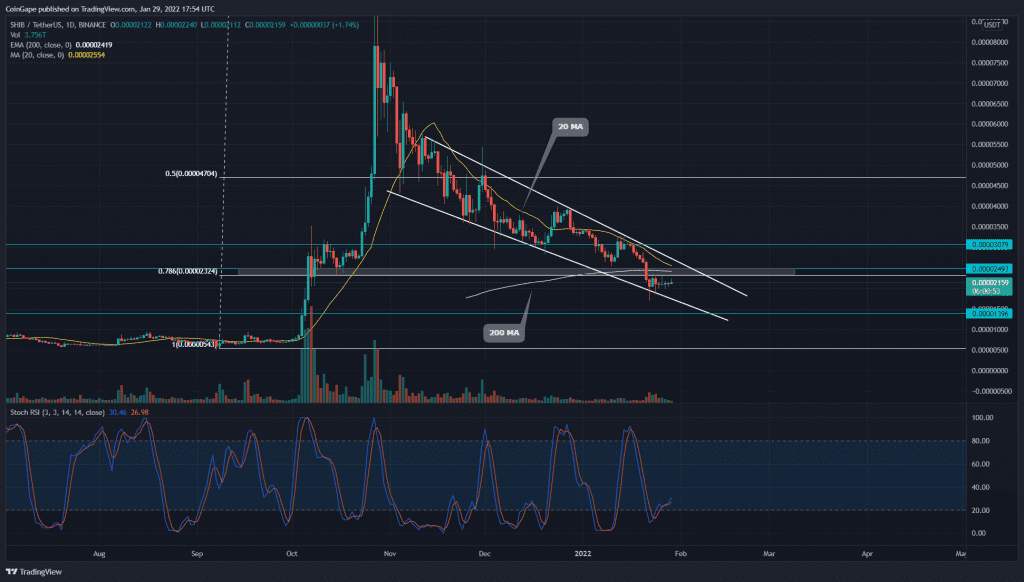
- The SHIB buyers lost the 200- MA support
- The intraday trading volume in the SHIB is $554.6 Billion, indicating a 17.9% fall.
 Source- Tradingview
As mentioned in our previous Shiba Inu price analysis, the SHIB buyers lost a crucial shared support level of 0.786 Fibonacci retracement level and 200-day MA on January 21st. With this breakdown, the token price was expected to plunge to the $0.000014 support after retesting the flipped resistance($0.000023) for sufficient supply.
- However, the descending trendline providing strong support to the SHIB price holds the coin just below the $0.000023 mark. This week the token chart shows several Doji candles, indicating uncertainty among the market participants.
- This recent free fall has engulfed the 200-day MA, indicating a bearish trend. Moreover, the 20 and 200-day is on the verge of giving a bearish crossover.
- The daily Stochastic RSI providing a bullish crossover among the K and D line struggles to rise higher, suggesting a lack of bullish momentum from bulls.
SHIB Price Forms An Inverted Pennant Pattern

Source-Tradingview
SHIB will remain in a bearish trend until the token price is under the influence of the falling parallel channel pattern. Furthermore, the token chart shows the price is resonating in an inverted pennant pattern whose breakout could free the token price from current consolidation.
If the sellers manage to sustain the price action below the dynamic resistance, the token would sink to the $0.000014 mark(-35%)
On a contrary note, the falling channel pattern hides an excellent bullish opportunity for crypto traders if the token give an upside breakout from the resistance trendline.
- Resistance- $0.000015, $0.0000150
- Support- $0.000015, $0.0000150