As the Bitcoin fear and greed index surged by 6 points over the last day, Solana registered double-digit 24-hour gains to reclaim the $102-support. Also, Fantom moved above its 4-hour 20 SMA while reclaiming the $2.09-level. On the other hand, Shiba Inu oscillated in a range now for over a week.
Solana (SOL)
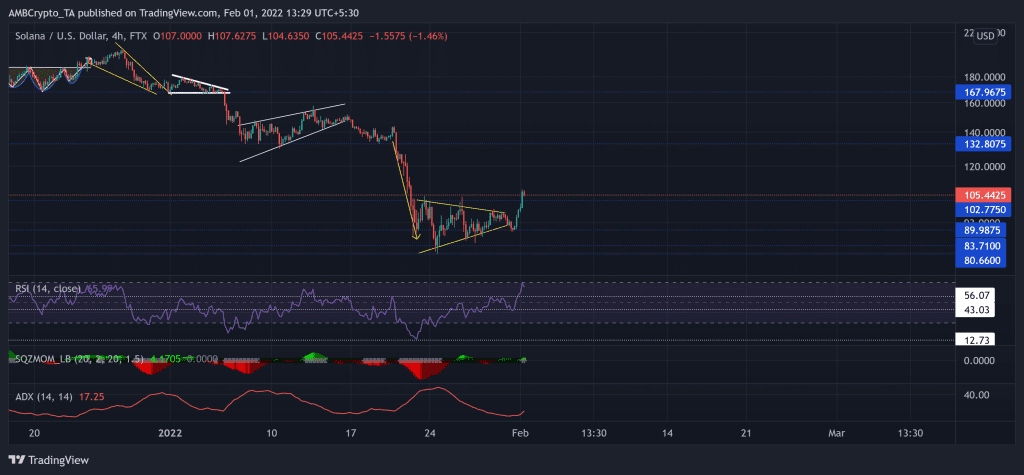
After breaching the $167-mark, the bears kept testing the $132-mark resistance (previous support). The recent sell-off saw a diminution of 43.7% (from 21 January) until its five-month low on 24 January.
The recent bearish pennant breakdown quickly reversed after the bulls stepped in at the $89.98-mark. As a result, the alt saw a 19.12% 24-hour gain. Any retracements from here would find a floor at the $102-level.
At press time, SOL traded at $105.4425. After plunging to its record low, the RSI upturned by a staggering 51 points from the oversold territory. Now, it reversed from the overbought region as it eyed to test the 56-mark. Also, the Squeeze Momentum Indicator unveiled a grey dot after nearly a week, hinting at a high volatility phase. Besides, the ADX continued to depict a weak trend for the SOL.
Shiba Inu (SHIB)

Source: TradingView, SHIB/USD
The meme-token swiftly declined and lost 58.6% of its value (from 27 December) until it poked its 15-week low on 22 January.
Then, it saw a reversal after the buyers stepped in at the $0.00001864-level. Post that, SHIB witnessed a bearish pennant on its 4 -hour chart. However, the bulls refrained from dwindling and upheld the $0.00002-level. The Immediate resistance continued to stand at the $0.000022-mark.
At press time, SHIB was trading at $0.00002164. After an impressive recovery, the RSI pulled back from its rising wedge. But it managed to find a close above the half-line, affirming a slight bullish preference. Nevertheless, the OBV still needed to topple its resistance to confirm a strong bull revival.
Fantom (FTM)

Source: TradingView, FTM/USDT
Since FTM reversed from the $3.32-level, the bears have exerted constant pressure. As a result, it lost nearly 48.07% (from 17 January) and gravitated towards its one-month low on 24 January.
Over the past few days, the alt marked a bearish flag and plunged below the $2.09-level. But with an impressive 8.8% 24-hour gain, it reclaimed this level on 1 February. The bulls managed to flip the 20 SMA (red) from resistance to support. From here on, the barrier for the bulls stood at the 50 SMA (cyan).
At press time, FTM traded at $0.0. The RSI saw a 19 point recovery that helped it cross the half-line. Now, it moved sideways and flashed neutral signs. Further, the DMI skewed in favor of buyers. But the ADX (directional trend) remained weak.