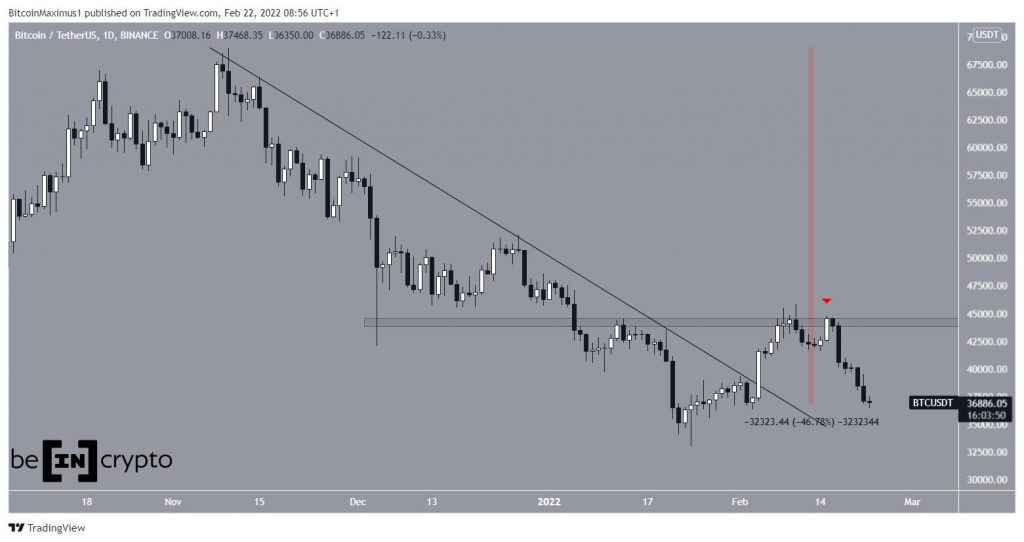
Bitcoin (BTC) has decreased considerably over the past seven days but has reached a short-term confluence of support levels, which could help to boost the price.
Bitcoin has been falling since Feb 15, when it was rejected near the $44,200 resistance area for the second time (red icon). So far, it has reached a low of $36,350 on Feb 22.
Measuring from the Nov 10 all-time high price, BTC has decreased by 47%.
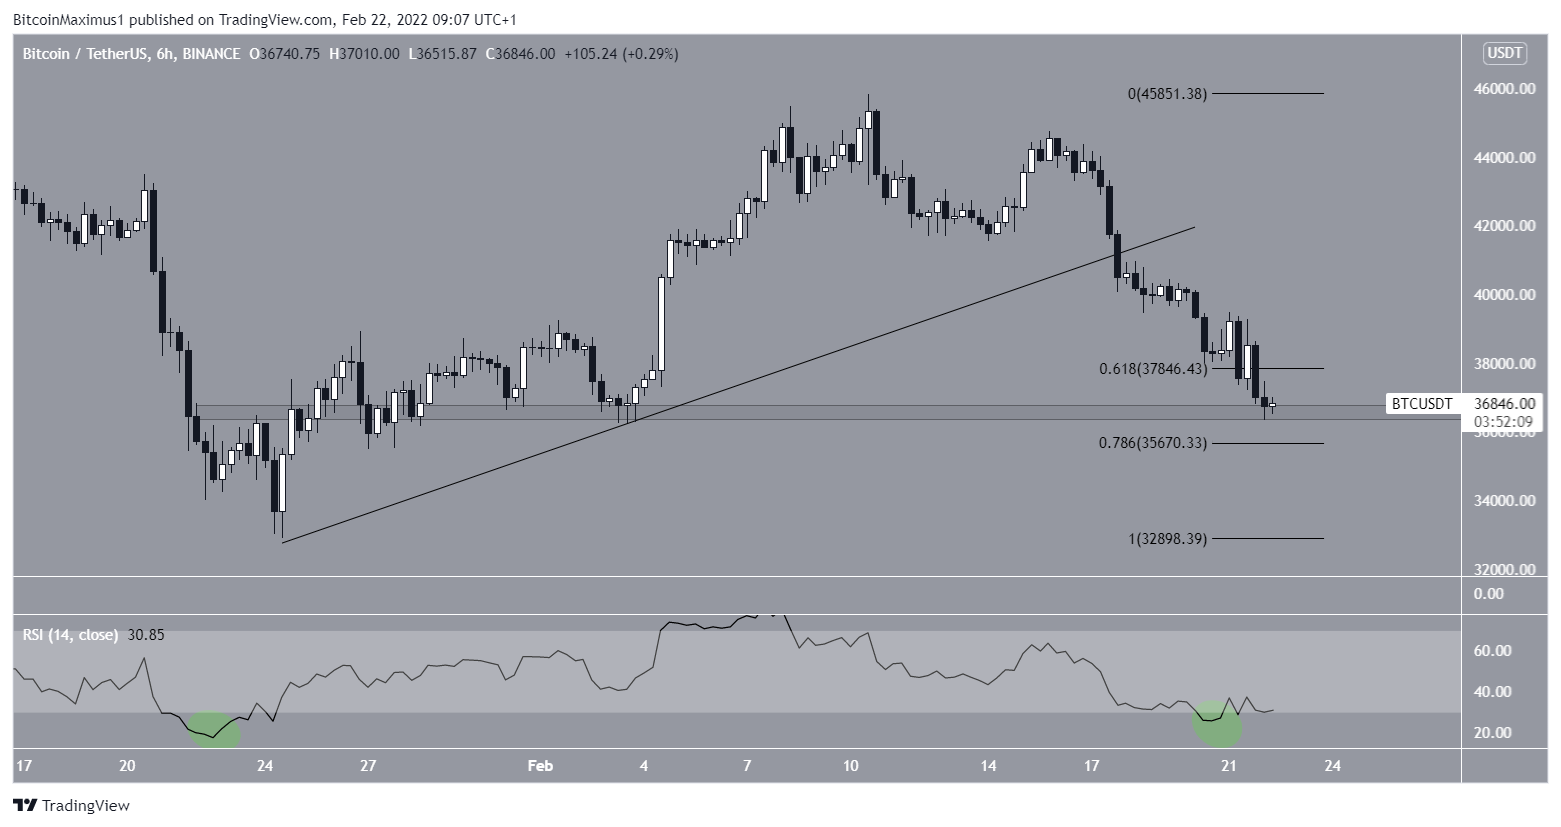
Short-term BTC breakdown
The six-hour chart shows that BTC has broken down from an ascending support line. Currently, it’s trading between the 0.618 and 0.786 Fib retracement support levels at $35,700-$37,700. This area is also a horizontal support level.
There are no clear bullish reversal signs beside the oversold RSI.
The RSI is a momentum indicator and readings below 30 are considered oversold. The previous time the RSI was this low was on Jan 23 and preceded a significant upward move.
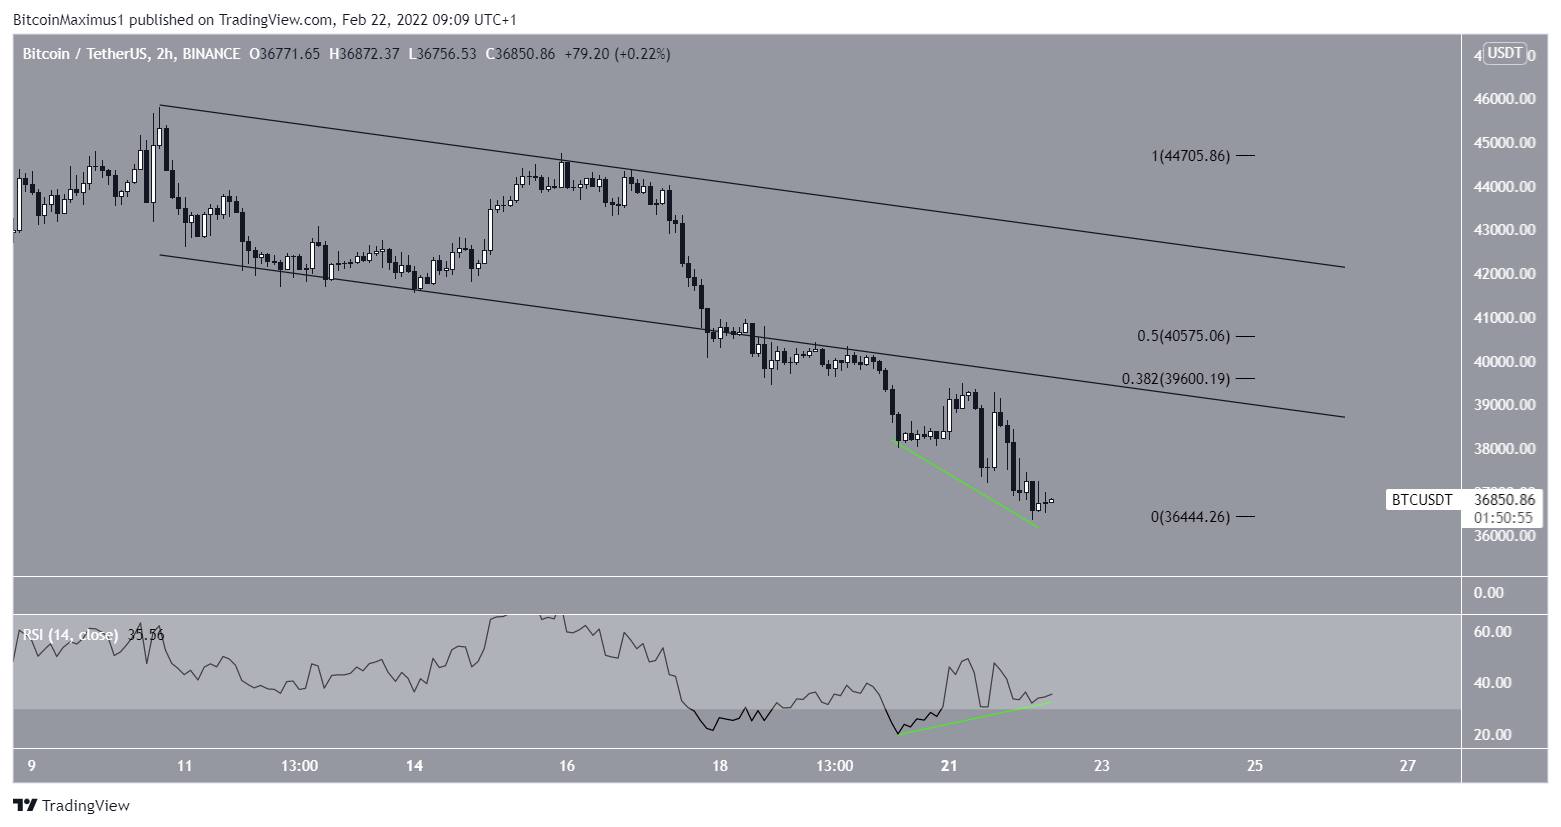
The two-hour BTC chart is slightly more bullish and shows a very pronounced bullish divergence in the oversold RSI.
If an upward move follows, the closest resistance levels to watch are $39,600 and $40,575. Besides being the 0.382 and 0.5 Fib retracement resistance levels, they correspond with the previous support line and midline of a descending parallel channel. BTC previously broke down from this channel on Feb 18.
Wave count analysis
There are two likely possibilities for the long-term Bitcoin count.
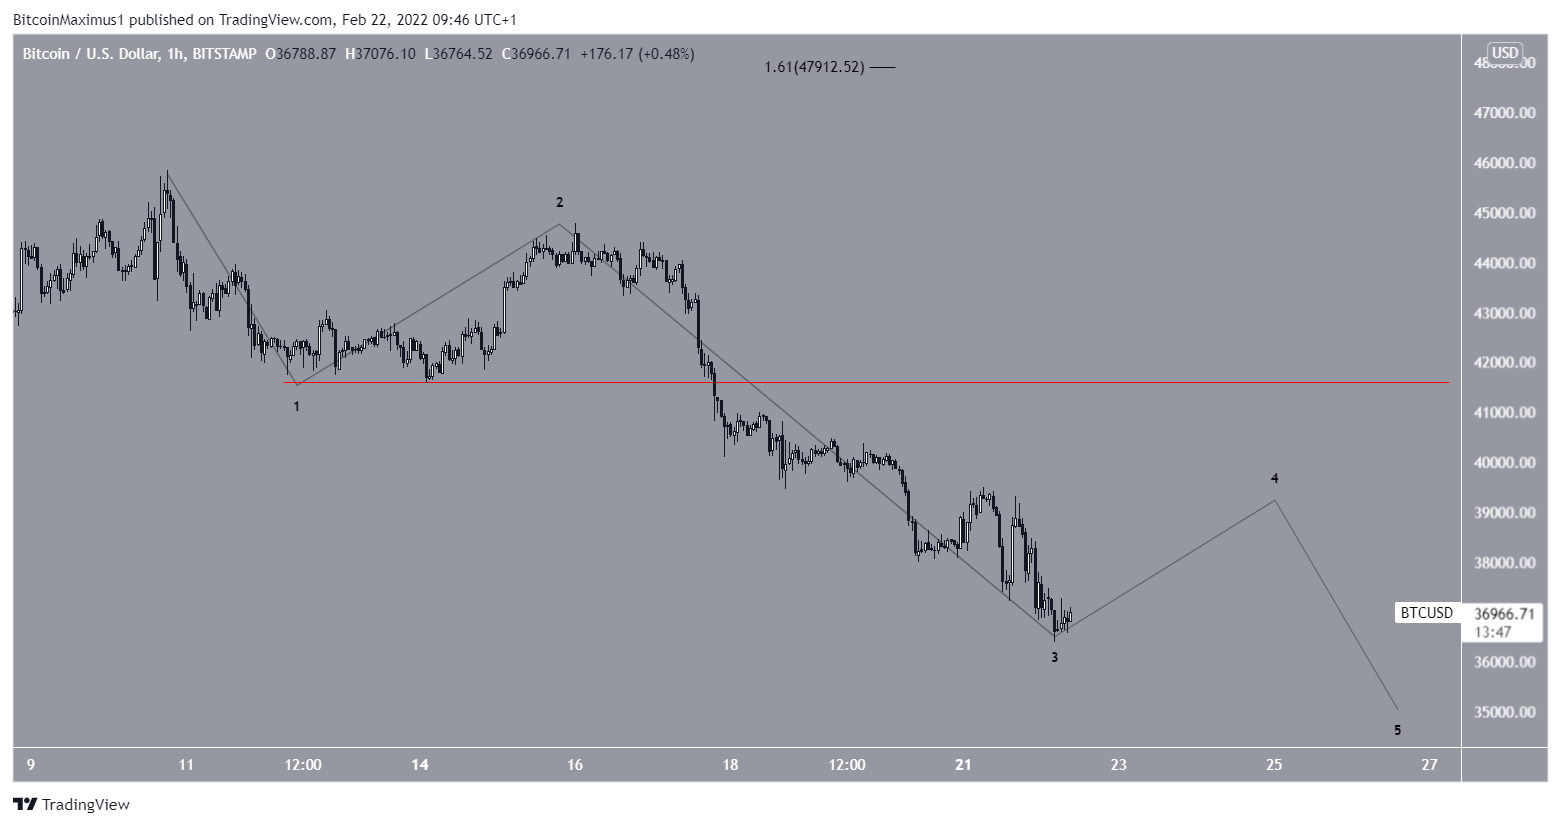
As for the short-term wave count, the bullish scenario suggests that the downward movement is a completed A-B-C trading structure. In it, waves A and C had a 1:2 ratio, which is not uncommon.
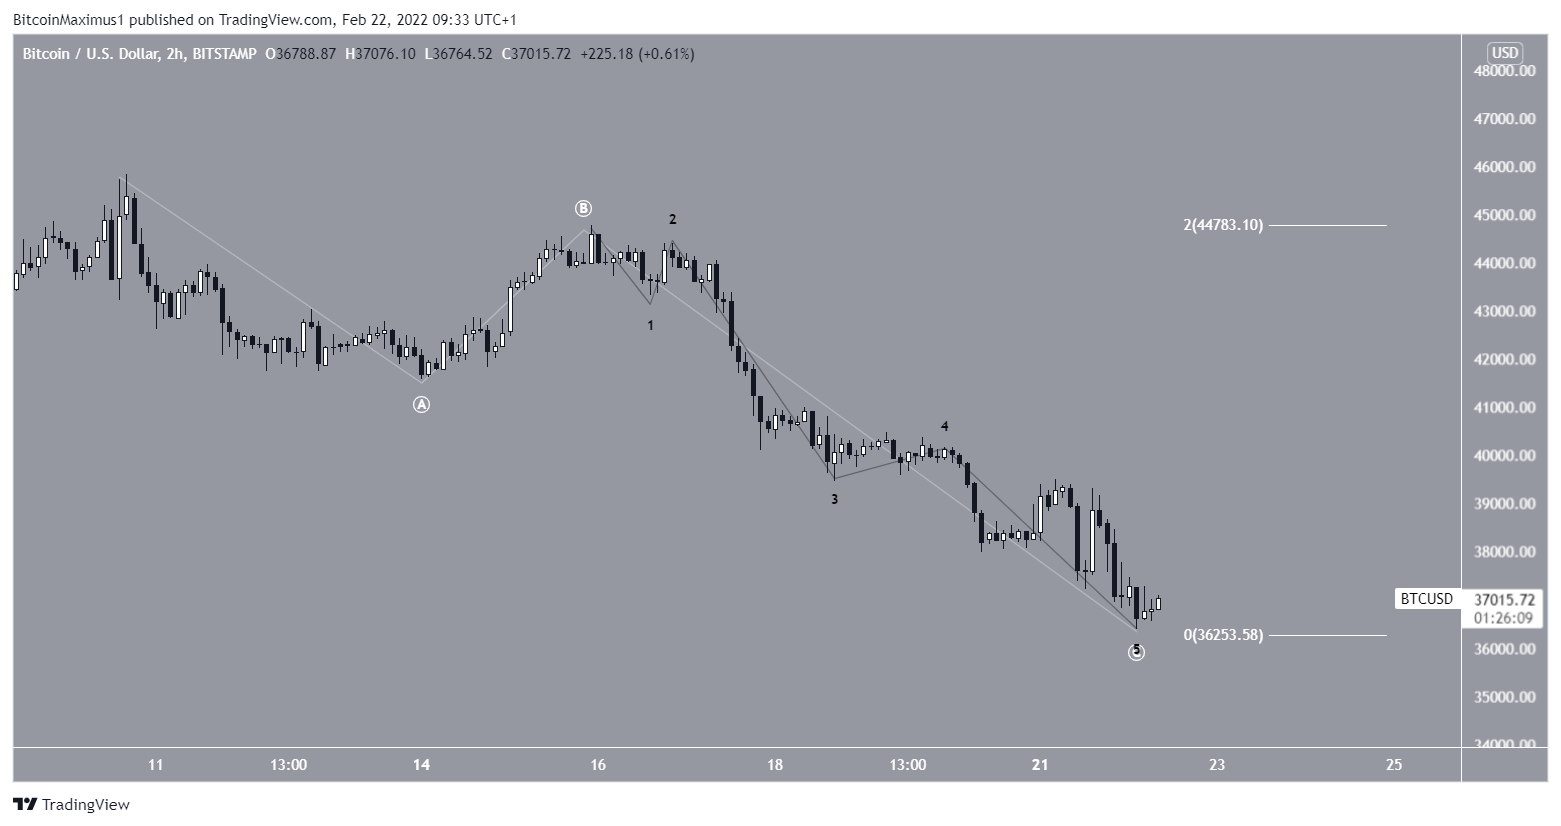
The sub-division is interesting since it shows a fourth wave triangle followed by an ending diagonal. Ending diagonals are usually followed by a very significant rebound. This fits with the possibility that BTC will retest resistance levels at $39,600 and $40,575.
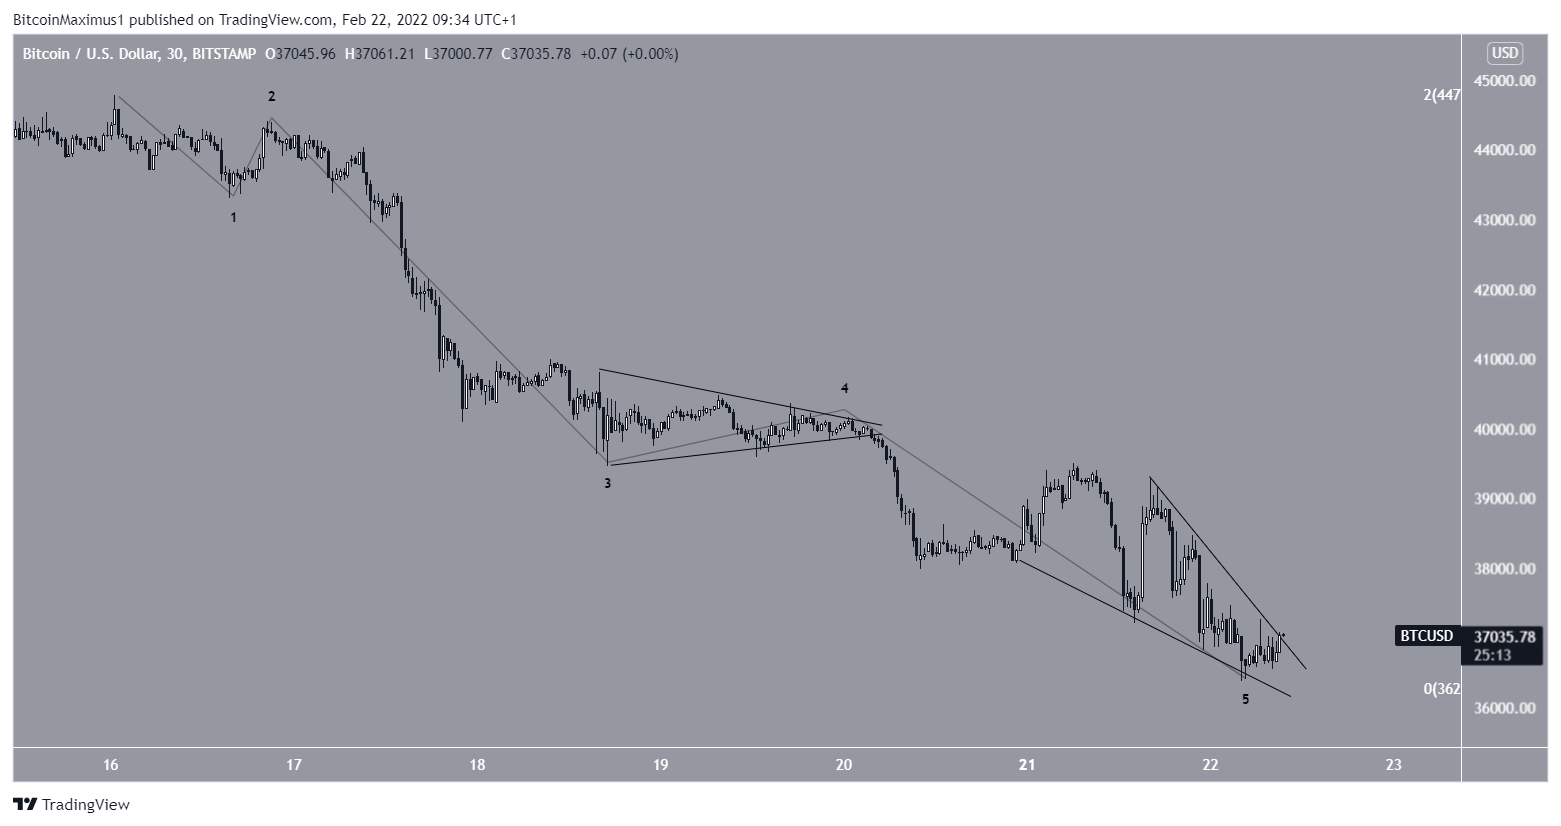
The bearish count suggests that the decrease is part of a bearish impulse instead. In it, BTC has just completed wave three of a five-wave downward pattern.
In this scenario, a smaller upward movement will follow, but will likely not break the wave one low at $41,575 (red line).
An increase above the line would confirm that the bullish count is transpiring and the short-term correction is complete.
For BeInCrypto’s previous Bitcoin (BTC) analysis, click here
Disclaimer
All the information contained on our website is published in good faith and for general information purposes only. Any action the reader takes upon the information found on our website is strictly at their own risk.