Over the last weeks, the Gala Games (GALA) price tumbled by 40%. The coin chart shows six consecutive red candles, which plunge the altcoin to the $0.21 mark. Today, the coin price turns green at this support, but can they sustain this buying?
Key technical points:
- The daily-RSI slope nosedive into the negative region
- The intraday trading volume in the GALA is $1.7 Billion, indicating a 7% gain.
 Source- Tradingview
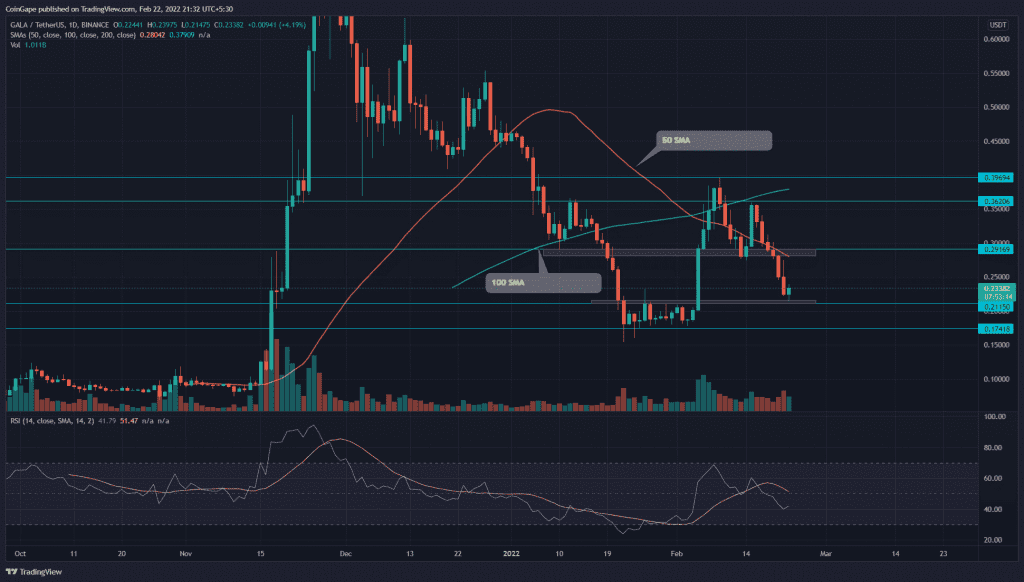
On February 16th, the GALA/USD pair turned down from the $0.36 mark. The sustained selling slumps the GALA coin to the local support of $0.28. Moreover, the technical chart displays a bearish double pattern, which bolstered the ongoing selling.
The bear gave a decisive breakdown from the neckline support($0.28) with a sufficient spike in trading volume. The follow-up selling plummeted the GALA coin to a prior resistance of $0.22, indicating a 23% fall from the breached support.
The GALA price trading below the trend defining 100-day SMA along with the down-sloping 50-day SMA indicates the bears are dominating the field.
The recent sell-off sinks the RSI(41) slope below 14-SMA and the neutral line, indicating a bearish sentiment among the traders.
GALA/USDT: 4-hour time frame chart

Source- Tradingview
Today’s green candle with a 4% intraday gain hints the $0.22 level has flipped to support. The GALA coin could hover above this support to gain sufficient demand before it pumps to $0.285.
However, the bullish assumption would be invalidated, if sellers pulled the GALA below the bottom support, resulting in an 18% decline to the $0.173 mark.
The average directional index(38) slope steady rally highlights the increasing selling momentum.
- Resistance level- 50-day SMA, $0.285
- Support level-$0.22, $0.173