While the overall sentiment worsened in the last 24 hours, MATIC, Decentraland and GALA revealed oversold readings on their 4-hour RSI. MANA still needed to challenge the $2.6-mark before confronting its supply zone while MATIC struggled to gather thrust to overturn the $1.5-zone.
Polygon (MATIC)
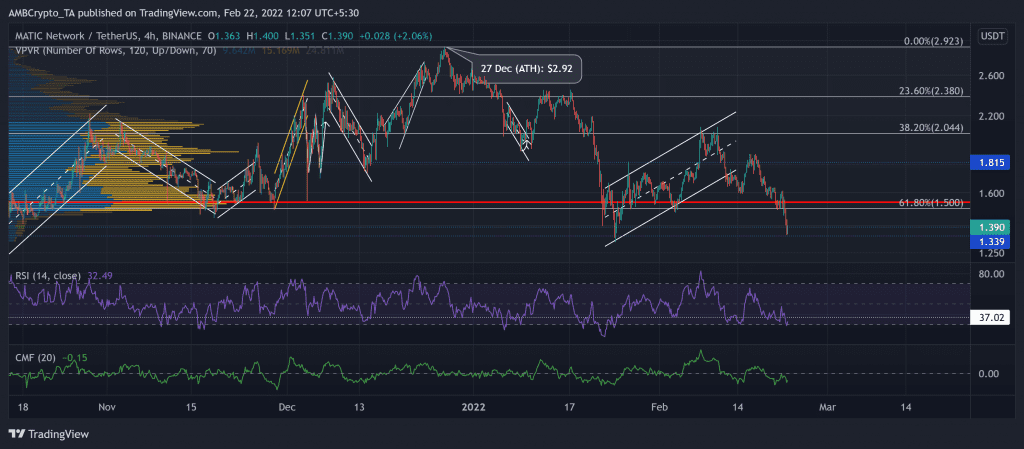
After attaining its ATH on 27 December at $2.92, MATIC fell to register a 54.24% decline and hit its three-month low on 24 January. But MATIC bulls quickly stepped in as it saw a 61.9% ROI until 10 February.
However, since then, the bears took over while bulls failed to defend the $1.8-level, followed by the vital Point of control (POC, red) in the $1.5-zone. This zone also coincided with the 61.8% Fibonacci support. As the $1.3-support stood sturdy, any bullish comebacks would find a testing point near its POC.
At press time, MATIC was trading at $1.39. The RSI steeply plunged toward the oversold region. Any recovery from here would find a ceiling at 37 for testing. Furthermore, the CMF favored the sellers while displaying some revival signs.
Decentraland (MANA)

Source: TradingView, MANA/USDT
Since touching its 11-week low on 22 January, the alt saw a staggering 107.4% ROI until 9 February. Then, MANA witnessed an up-channel (yellow) breakdown that pierced through crucial price points.
The alt saw two down-channels on its 4-hour chart in the last 12 days. The recent down-channel breakout reversed from the 50 EMA (cyan), affirming the bearish edge. Moreover, the bearish engulfing candlestick created a strong supply zone in the $2.7-$2.9 range. MANA lost more than 15% over the past day while the bulls ensured the $2.4-support. Any comebacks would find resistance at the $2.4-mark, followed by the supply zone.
At press time, MANA traded at $2.47. its RSI approached the oversold region. Consequently, it entered into a revival phase and eyed at the 41-resistance. Further, the MACD projected a strong bearish preference due to a major sell-off over the last day.
GALA

Source: TradingView, GALA/USDT
GALA lost its bullish vigor after it failed to uphold the $0.421-resistance. Since losing this mark, it lost more than half of its value and hit its two-month low on 22 January. Since the past month, it found an oscillation range between the $0.37 and the $0.15-mark.
The recent sell-off phase pushed GALA below the mean (red) of Bollinger Bands. Post which, it kept testing the lower band of BB as the bears kept exerting pressure. Any reversals from here would continue to find resistance near the $2.6-zone.
At press time, GALA traded at $0.224. The RSI witnessed a substantial fall into its oversold mark. A close above this level would open up possibilities to topple the 36-resistance.