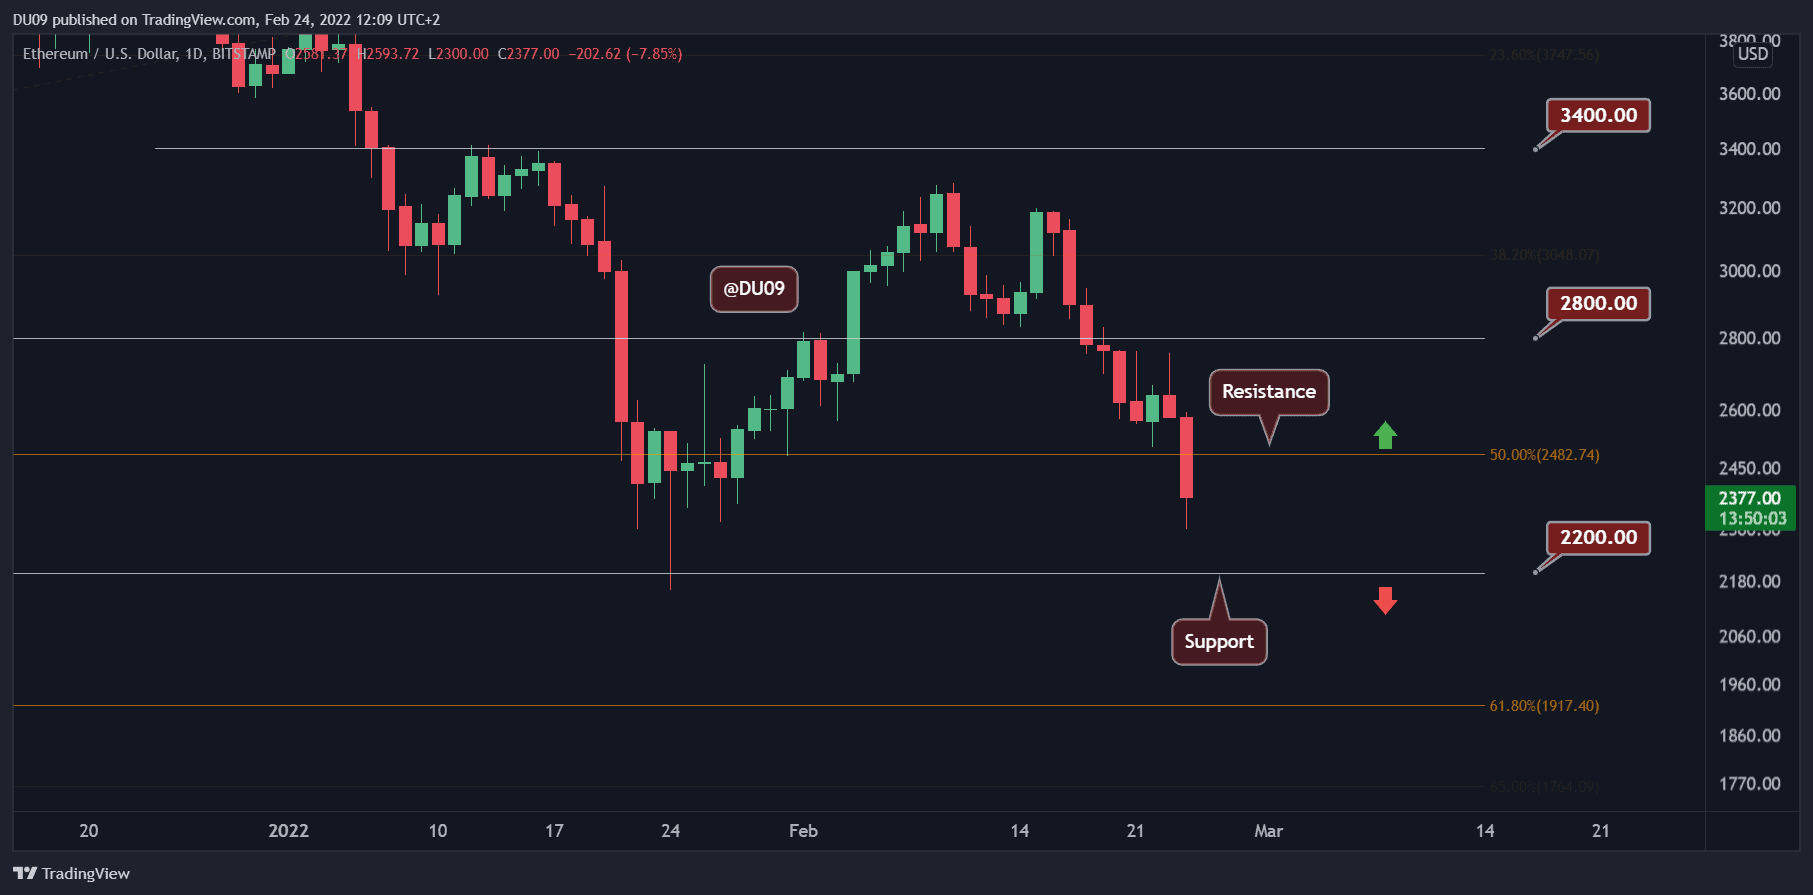
Key Support levels: $2,200, $1,900
Key Resistance levels: $2,500
ETH broke the support at $2,500. This opens the way for a potential drop towards $2,200, which is the first serious level to halt any further declines. The previous support at $2,500 has turned into resistance, and the market outlook is grim. The US stock market is due to open later today and may pull ETH lower still.
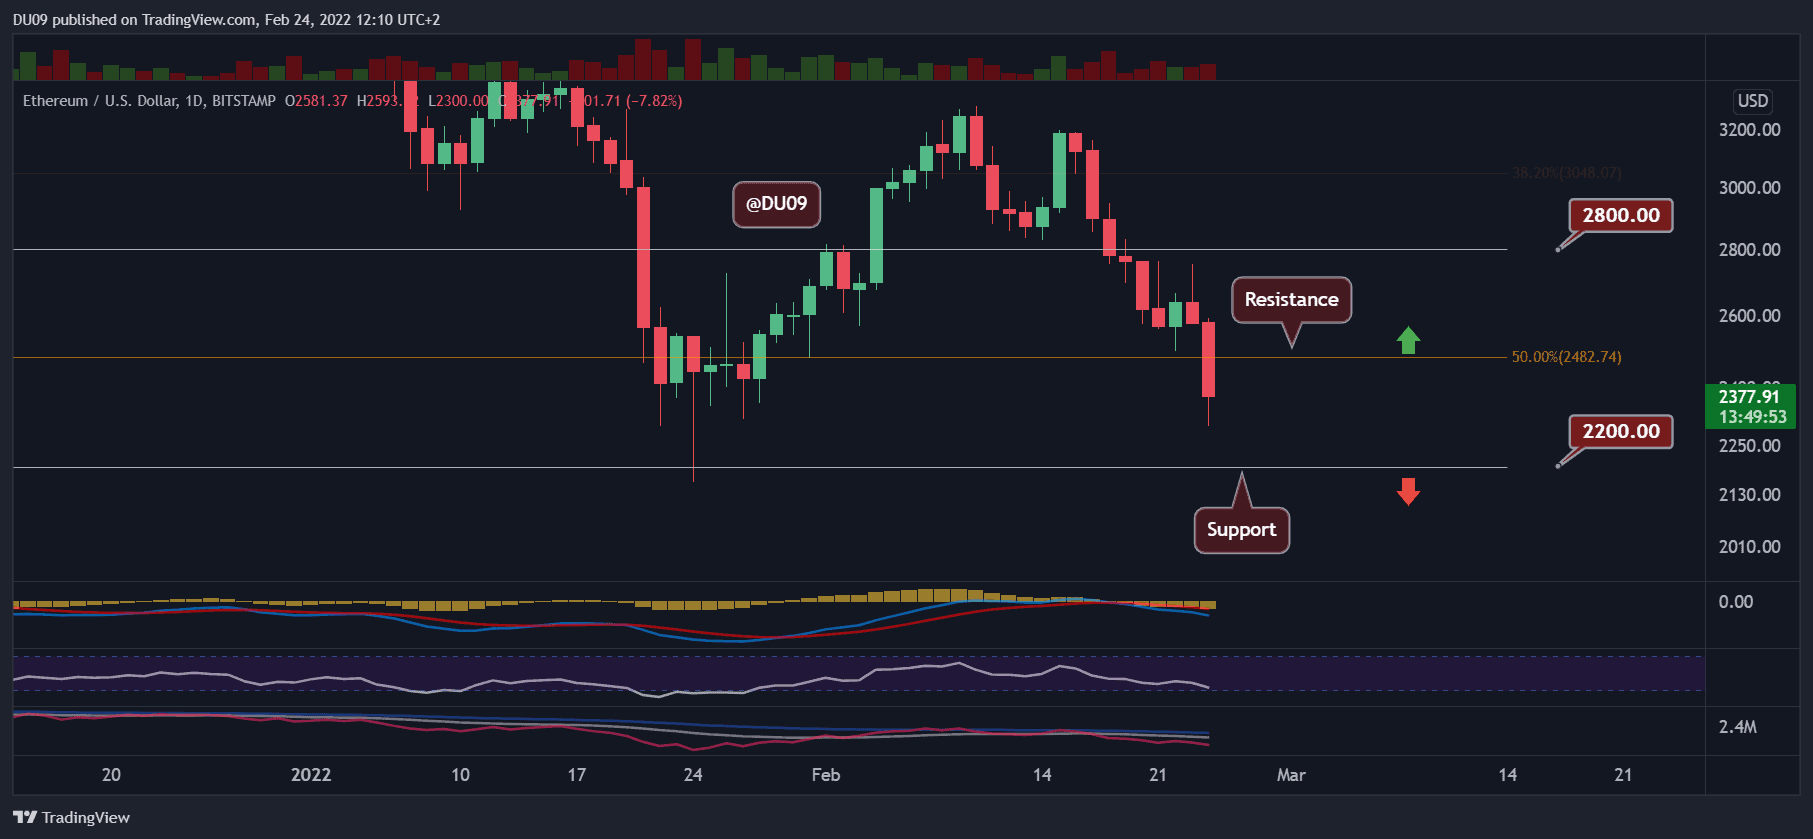
Technical Indicators
Trading Volume: Today’s volume is in red and increasing. This means that the bearish momentum is intensifying.
RSI: The daily RSI is falling and approaching the oversold area. It is likely that it will fall under 30 points.
MACD: The daily MACD is bearish and painted a lower low on the histogram. This is a bearish signal.
Bias
The current bias for ETH is bearish.
Short-Term Price Prediction for ETH
The possibility of ETH falling to $2,200 seems high at the time of this writing. This is especially true in light of the current macroeconomic tension that’s riddling all markets. Once there, the price might bounce, but it’s important to remain very careful and expect increased volatility in the coming days.
Binance Free $100 (Exclusive): Use this link to register and receive $100 free and 10% off fees on Binance Futures first month (terms).
PrimeXBT Special Offer: Use this link to register & enter POTATO50 code to receive up to $7,000 on your deposits.
Disclaimer: Information found on CryptoPotato is those of writers quoted. It does not represent the opinions of CryptoPotato on whether to buy, sell, or hold any investments. You are advised to conduct your own research before making any investment decisions. Use provided information at your own risk. See Disclaimer for more information.
Cryptocurrency charts by TradingView.