The early February gain in GALA price was backed by $5 Billion investment plans announced by the organization to bolster its Non-Fungible token offering by buying intellectual property rights and building a theme park. However, the recent sell-off in the crypto market has nearly nullified these gains over a fortnight. Moreover, a retest of the $0.2.15 support raises the threat of a downtrend continuation.
Key technical points:
- The GALA price registered 44% fall in the last two weeks
- The intraday trading volume in the GALA is $1.2 Billion, indicating a 2.86% loss.
 Source- Tradingview
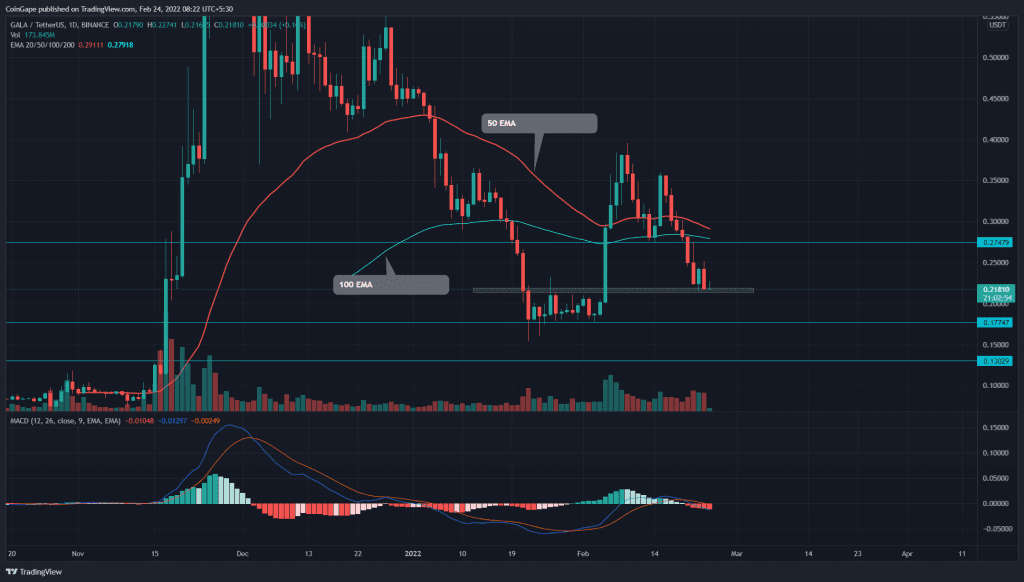
In February’s first week, the GALA buyers finally broke the consolidation phase having $0.177 as base support. The altcoin registered a 135% gain to the Feb 19th high($0.396). After two failed attempts to surpass the $0.4 mark, the coin price tumbled to local support of $0.275.
A bearish breakout from a double bottom pattern intensified the selling pressure and implied further correction to a prior resistance of $0.215.
The 50-and-100-day EMAs curving down suggests the bears are wresting control from bulls. Moreover, the MACD indicators show the fast and slow lines are poised to nosedive below the midline, offering additional confirmation for short-sellers.
GALA/USDT: 4-hour time frame chart

Source- Tradingview
On February 22nd, the GALA buyers tried to bounded back from the $0.215 mark, indicating the resistance has flipped to support. However, a bearish engulfing candle on the next day, pulled the altcoin back to the bottom support, threatening further downfall to January’s low($0.177).
A breakdown and closing below $0.215 support would sink the altcoin by 18%, resisting the $0.177 level. Further extension of losses would hint at a downtrend resumption.
On a contrary note, if buyers managed to rebound from $0.177 support, it would indicate the traders are buying this dip and would reattempt to rechallenge the swing high resistance($0.4).
- Resistance level- 50-day SMA, $0.285
- Support level-$0.215, $0.17