The Sandbox(SAND) price has been consolidating within a narrow range for over two weeks now. However, the recent reversal from the $3.6 resistance now teases a support fallout of $3.38. Will SAND sellers tumble the altcoin to the $3 mark?
Key points:
- The SAND price forms an evening star candle in the weekly time frame chart
- The daily-RSI chart shares weakness in bullish momentum
- The intraday trading volume in SAND price is $825 Million, indicating a 3.29% loss.
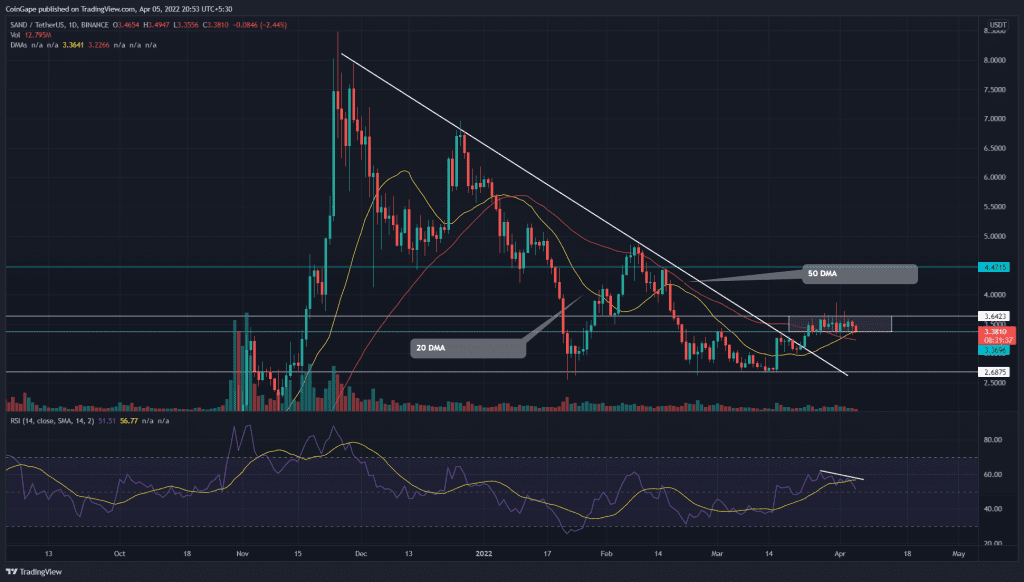
 Source- Tradingview
Since the retracement rally began in November 2021, the Sandbox(SAND) sellers were actively responding to a descending trendline which plunged the altcoin to the $2.6 mark. Furthermore, the buyers restricted any further losses from this support and rebounded the coin price to a bullish breakout from the overhead resistance.
The altcoin rose 11% after the breakout and hit the $3.6 resistance on March 25th. Since then, the traders have witnessed a sideways rally resonating within the mentioned resistance and $3.38 support.
Today the SAND price is down by 2.27% and retests the bottom support level of the range. If sellers provide a breakdown and candle closing below the $3.38 mark. The escalated selling pressure would dump the coin price to the $3 psychological level.
Alternatively, if buyers mount strong support at the $3.38 level, the range-bound rally would continue for a few more sessions.
Technical analysis
Despite a sideways rally in price action, the RSI sloping descending lower indicates weakness to the bullish momentum. This bearing divergence would bolster sellers for support breakdown.
However, the rising 20 DMA coincides with the $3.38 support to maintain strong support at the $3.38 mark.
- Resistance levels- $3.64, $4
- Support levels- $3.4 and $3