Bitcoin’s rally has come to a halt as the price was rejected from the significant 200-day moving average.
Technical Analysis
By: Edris
Daily timeframe:
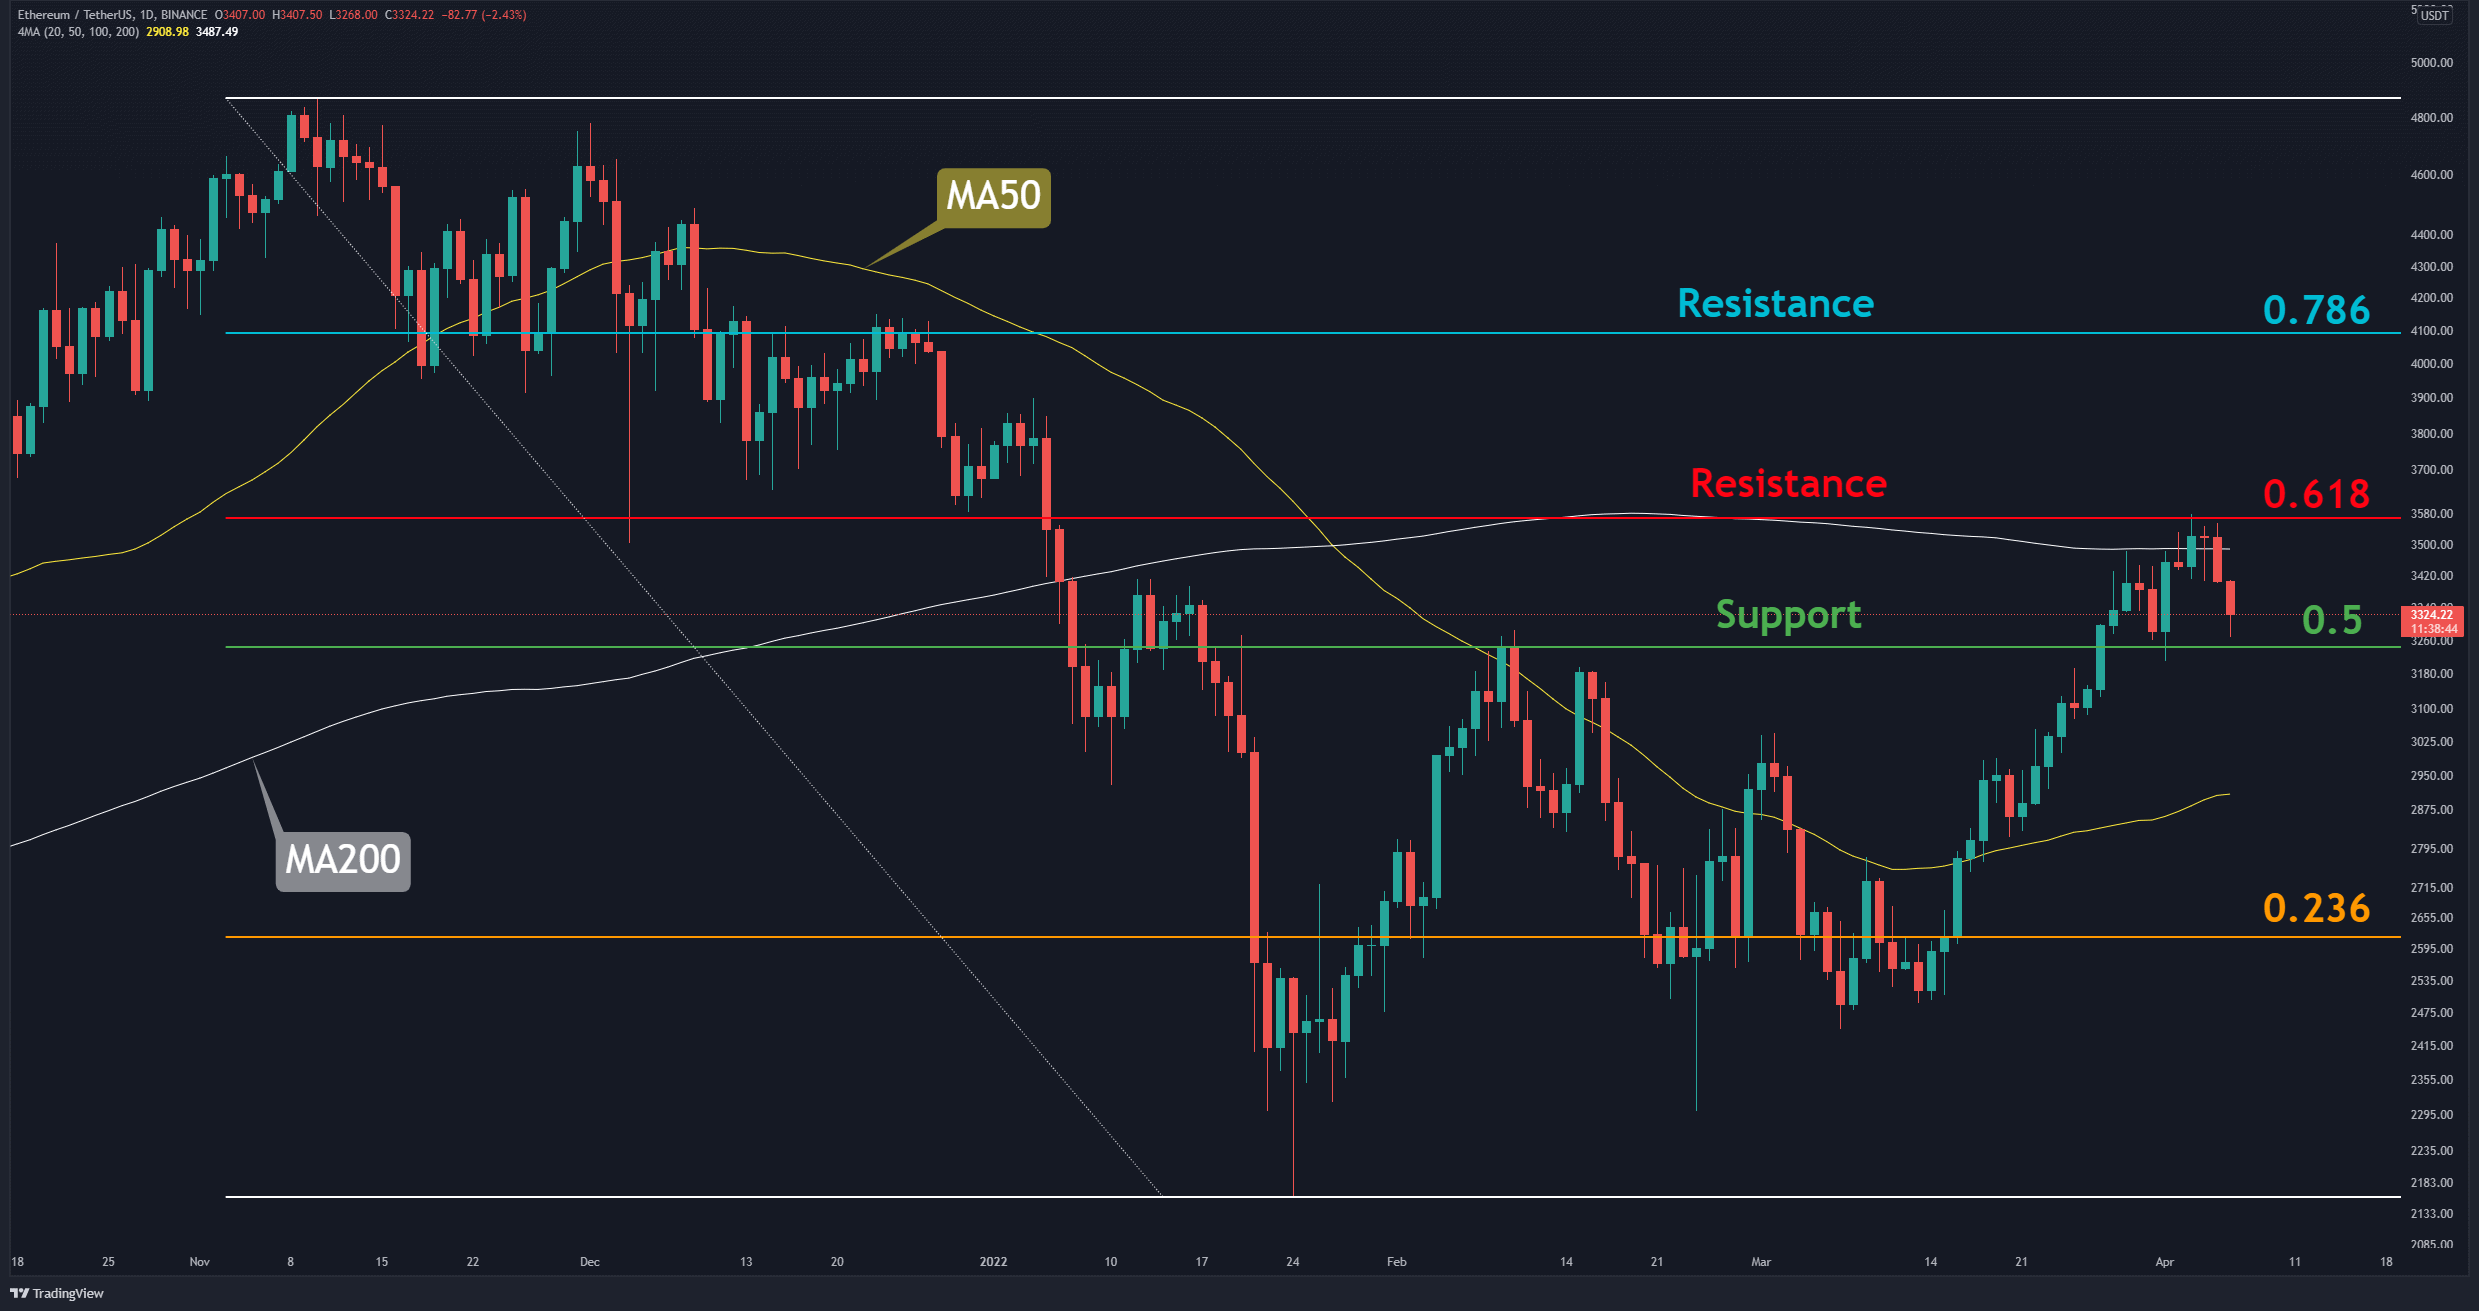
Historically, the 200-day moving average has been reliable support in bull markets and strong resistance in bear markets. The price was initially supported at the broken $45K level, which was turned into support after the drop from the moving average.
However, it seems likely for this zone to get broken to the downside considering the current price action. As the 200-day moving average remains the most significant obstacle in the way of a bullish trend, the 50-day MA is crossing the 100-day MA to the upside, which is considered a bullish signal.
The price could oscillate in the range between these levels for now until a clear bullish or bearish breakout occurs. In the bullish case, the next target would be the $52K zone. On the other hand, the $36K level would be the first support in a bearish scenario.
4-hour timeframe:
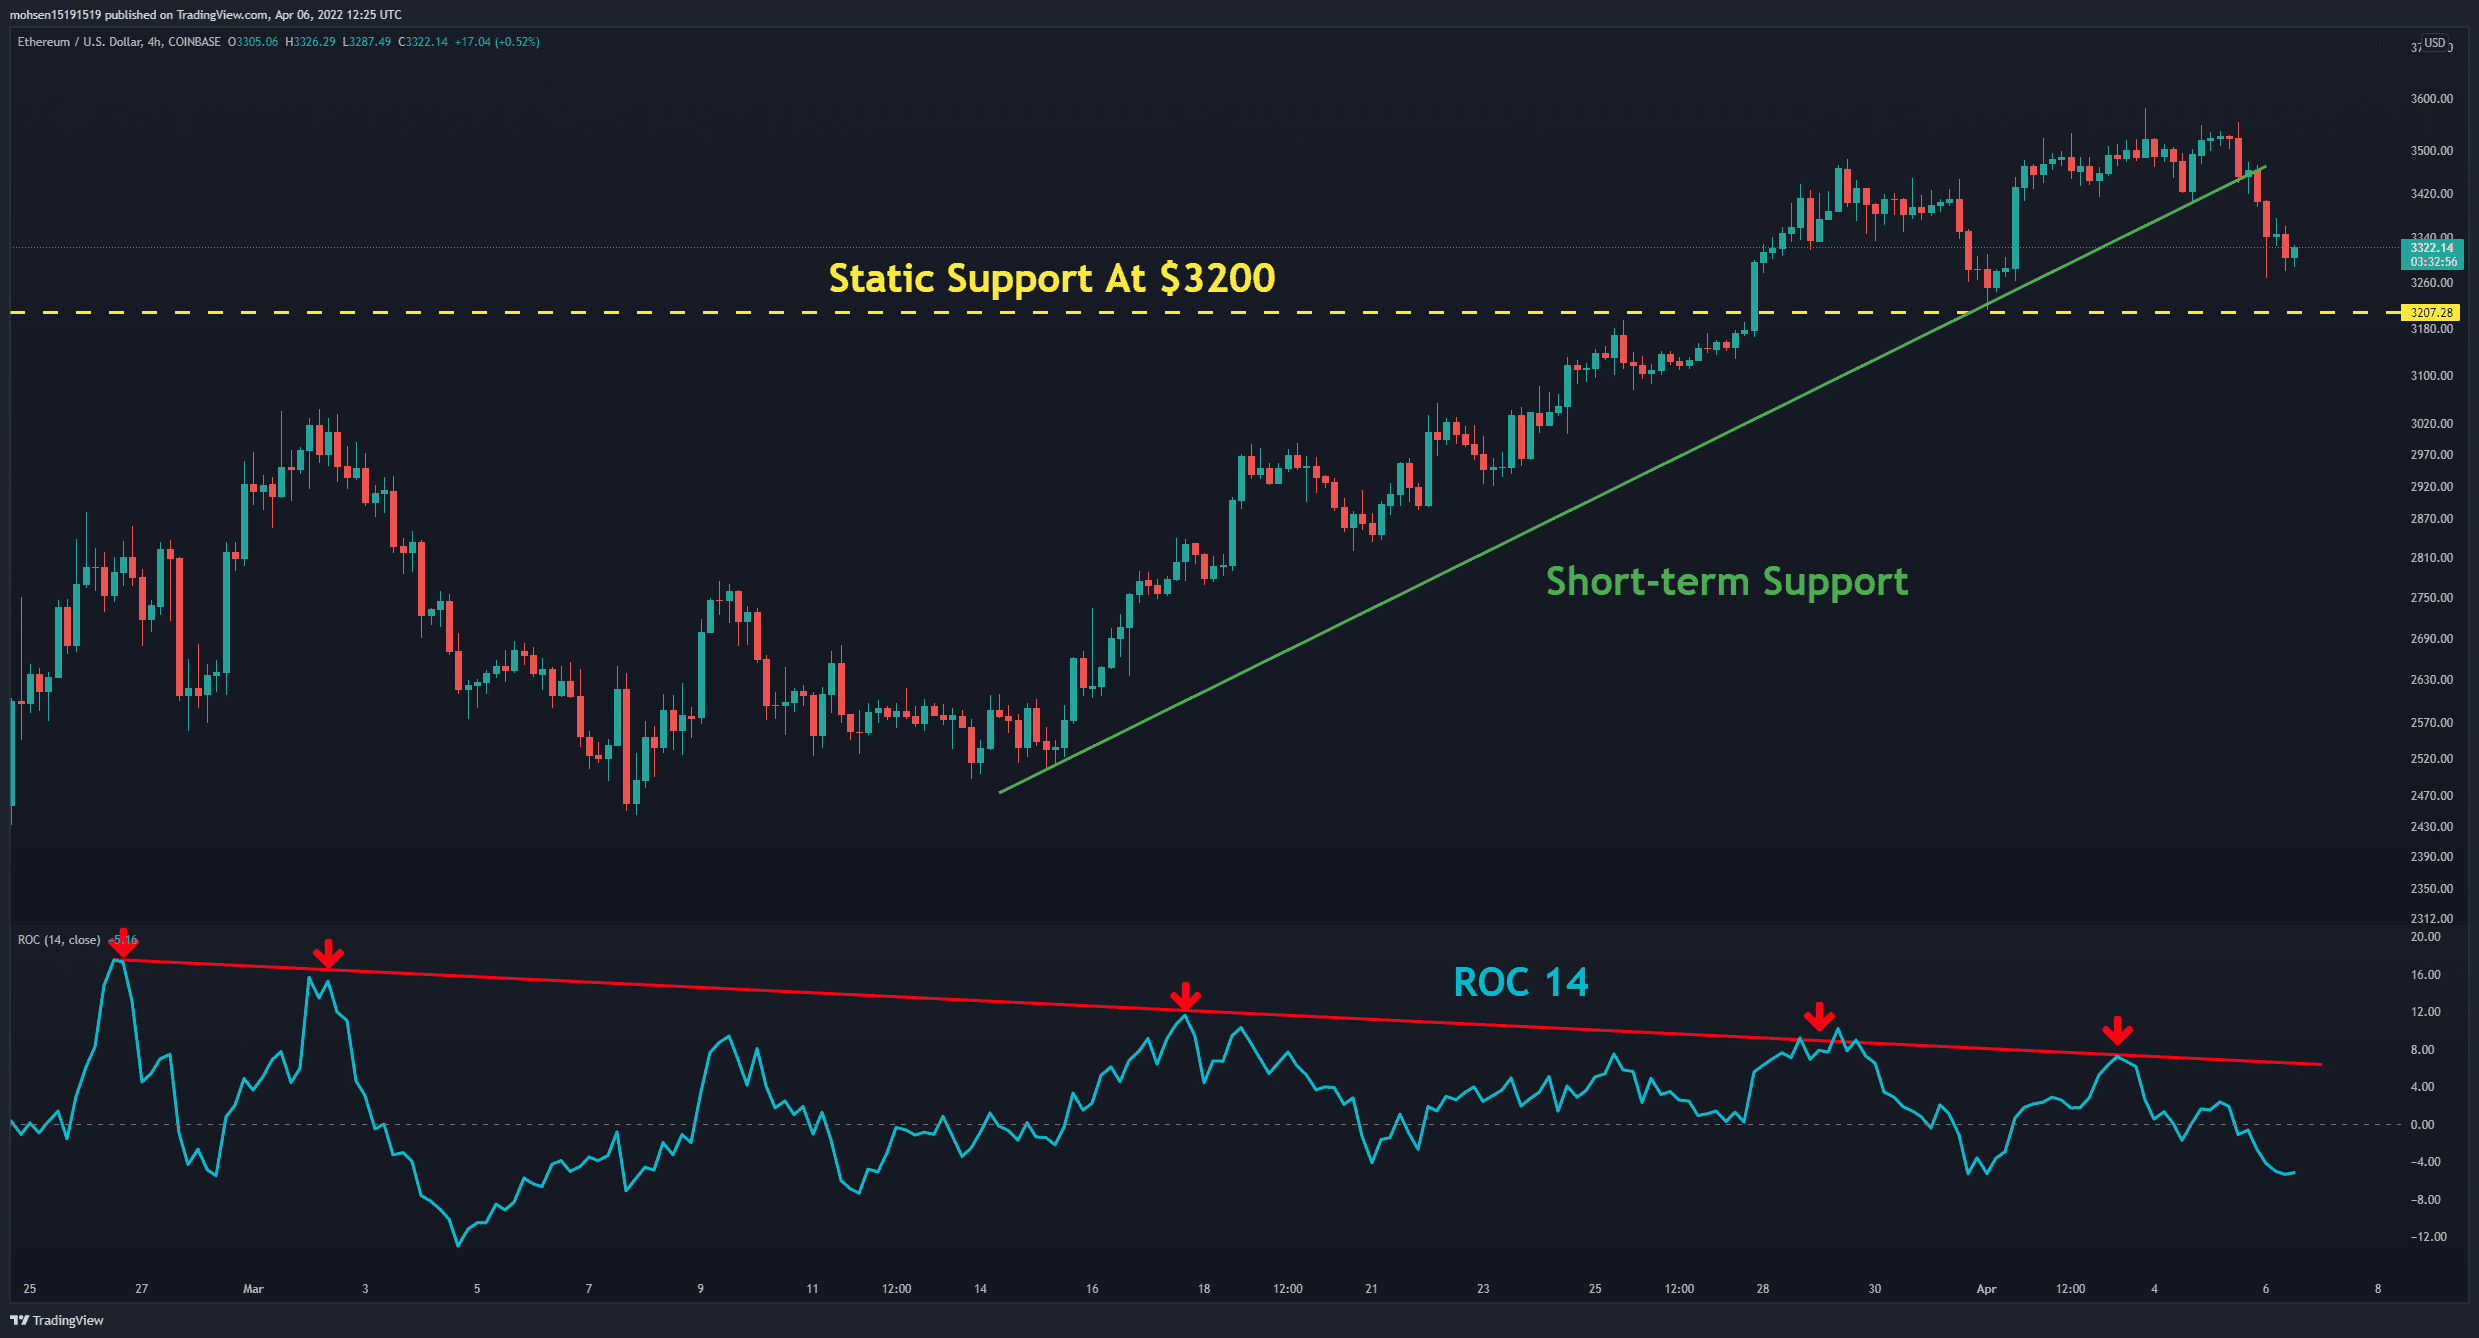
On the 4-hour timeframe, the price has been rejected from the top of the bearish flag pattern. If the price fails to break above the flag, which is a bearish continuation pattern, another drop and even prices below the $33K mark could be expected.
For now, if the price loses the lower boundary of the highlighted red zone ($45K), the $42K level could be the next support, and if this level also fails to hold the price, a retest of the bottom of the flag and the $36K area would be imminent.
The RSI indicator is also indicating that the bears are in full control at the moment. However, it is approaching the oversold area (below 30%), so a short-term pullback or a local bottom could be near. Overall, the 4-hour timeframe looks completely bearish with the third touch rejection of the bearish flag. Albeit, things could take a turn if the price could break above the flag, which would fail the pattern and cause a probable rally towards higher prices.
On-Chain Analysis
By Shayan:
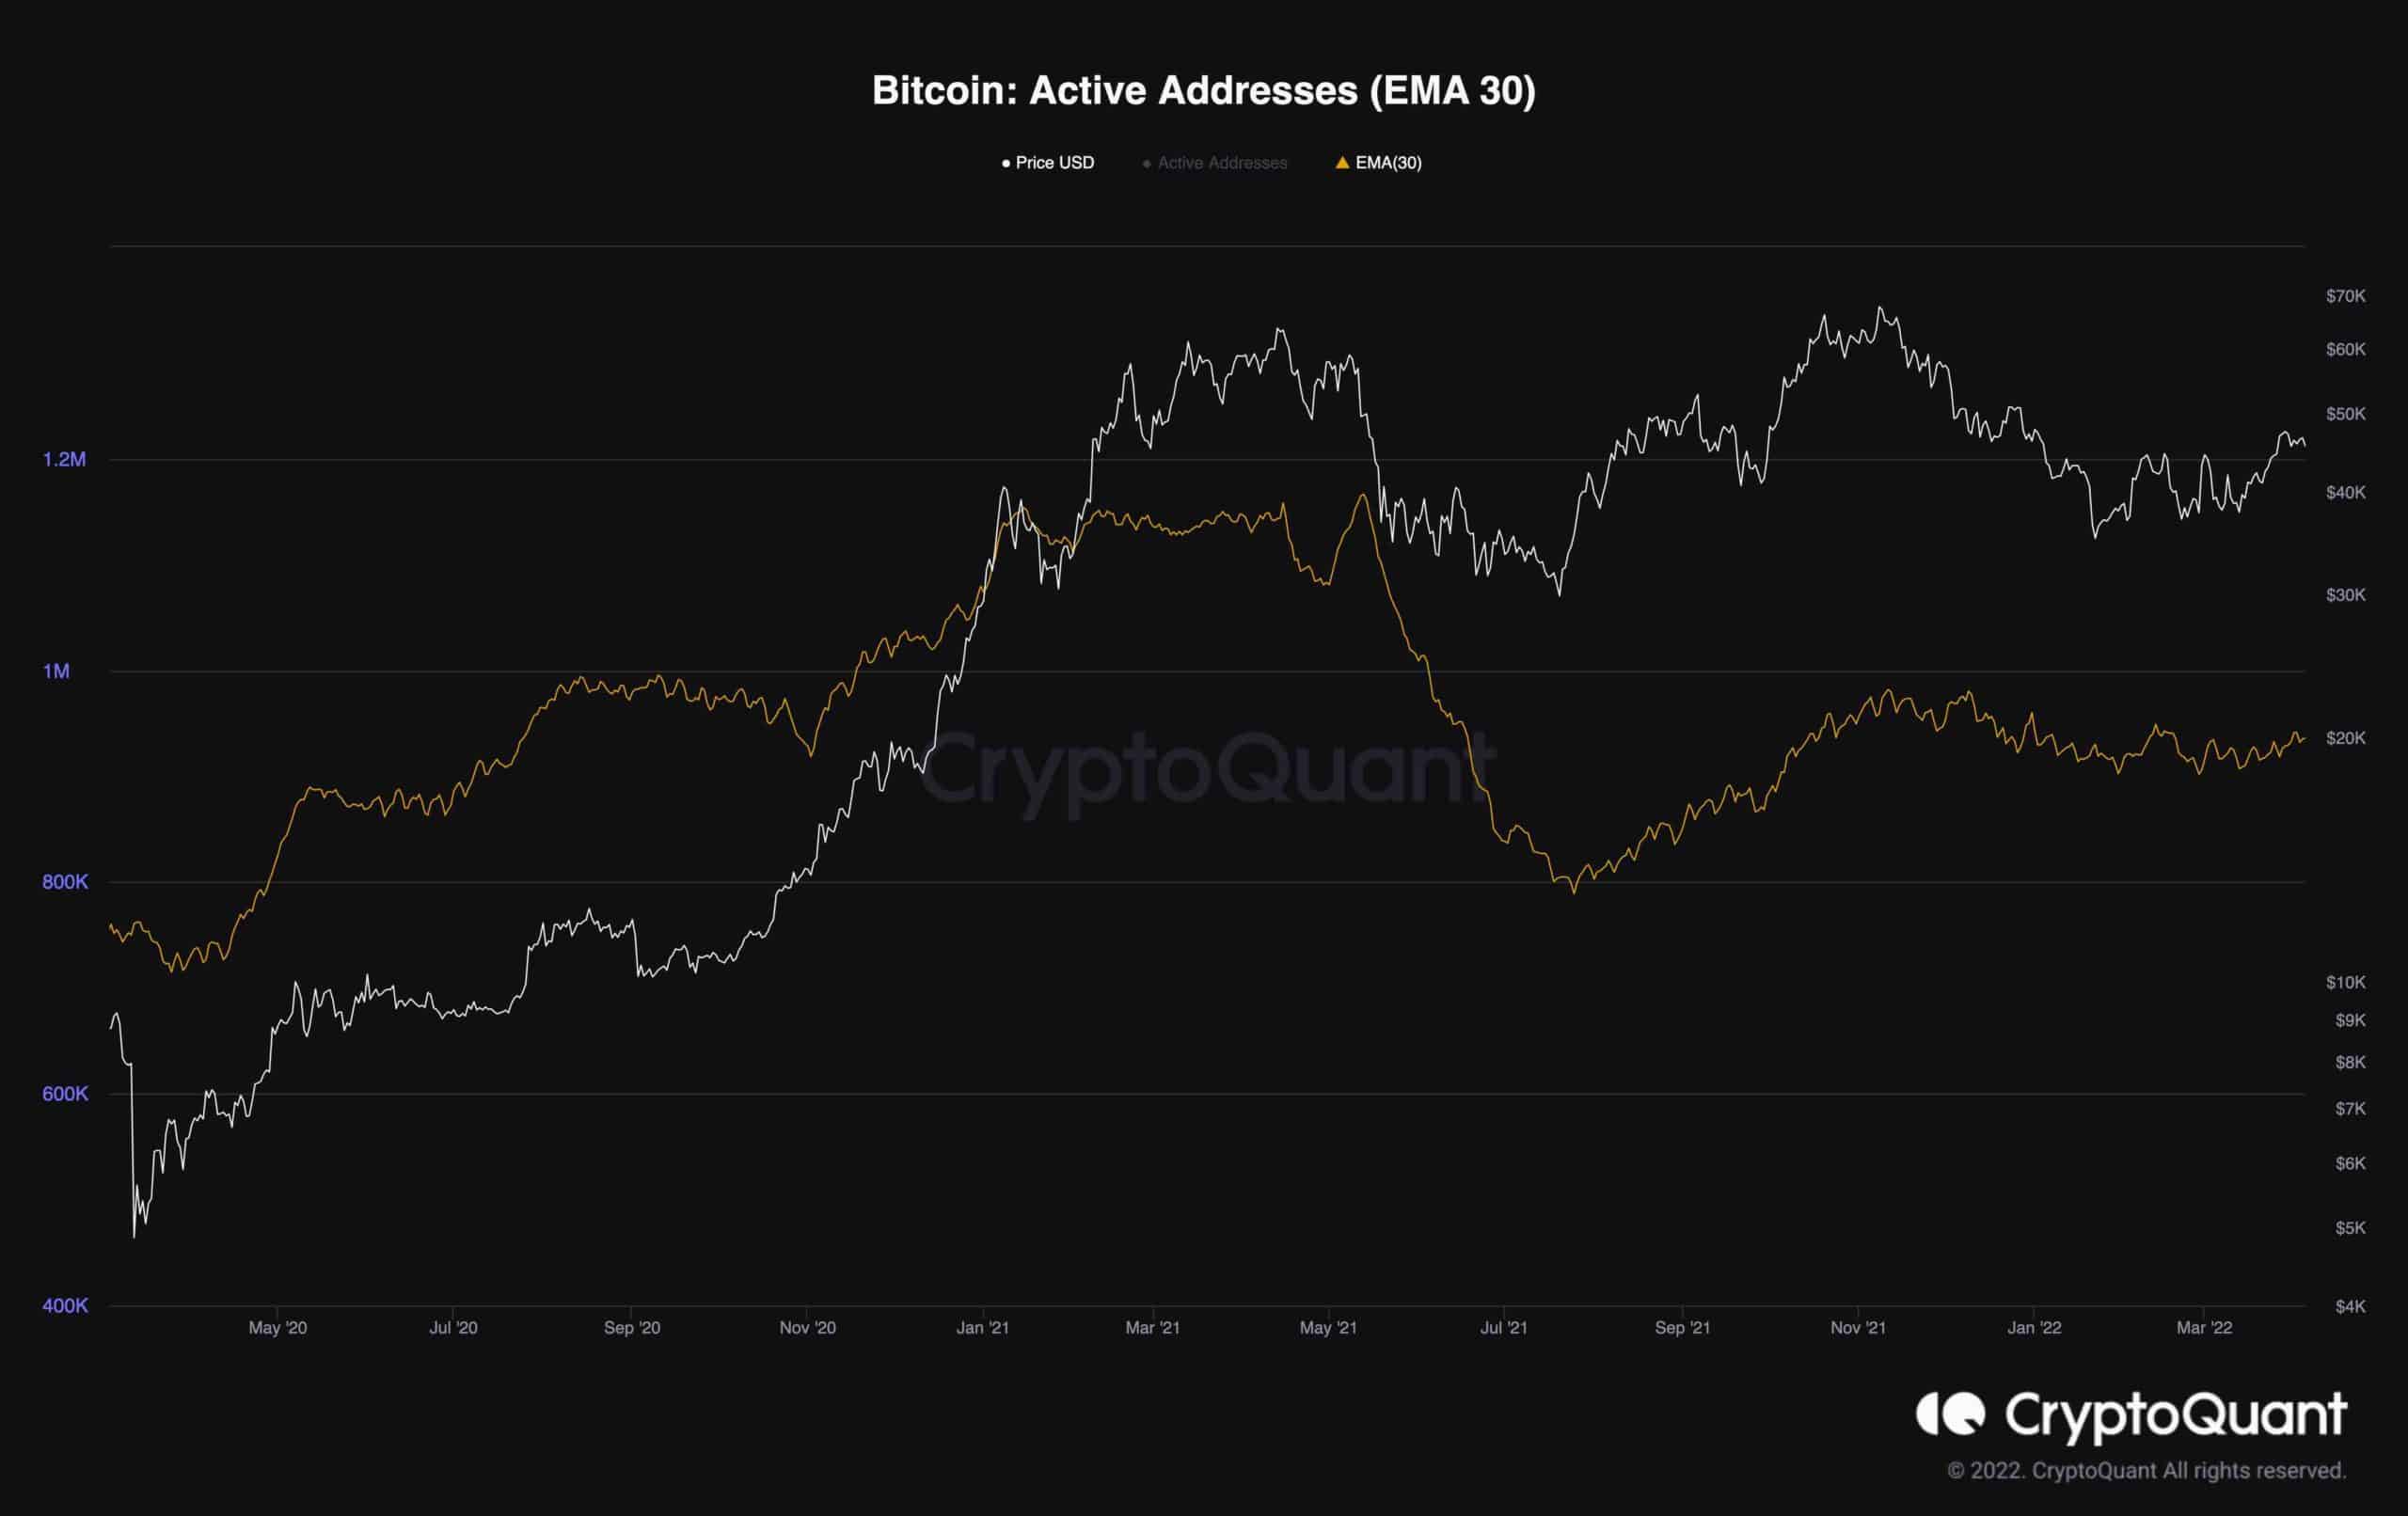
On-chain experts are essentially focused on supply dynamics. However, there is a demand side to the price discovery equation as well. Most long-term holders have maintained their strong HODL-conviction and have accumulated more over the previous year, notably after the $64K ATH in March 2021.
When looking at the number of active addresses (30-day EMA), it’s clear that the network had considerably fewer active users at $69k than the $64k peak. The bearish divergence revealed a significant lack of demand.
Many individual investors were hesitant to return to the market because of rumors about the Fed’s tapering and rate rises. In the future, this measure will be a key signal to keep an eye on. Furthermore, if bitcoin is set to reach a bottom and initiate a significant rally, it should be accompanied by an increase in active addresses. If it doesn’t, it’s most likely a bull trap.
Binance Free $100 (Exclusive): Use this link to register and receive $100 free and 10% off fees on Binance Futures first month (terms).
PrimeXBT Special Offer: Use this link to register & enter POTATO50 code to receive up to $7,000 on your deposits.
Disclaimer: Information found on CryptoPotato is those of writers quoted. It does not represent the opinions of CryptoPotato on whether to buy, sell, or hold any investments. You are advised to conduct your own research before making any investment decisions. Use provided information at your own risk. See Disclaimer for more information.
Cryptocurrency charts by TradingView.