Over the past two weeks, the (Litecoin)LTC buyers struggled to sustain above the breached resistance trendline of the channel pattern. However, despite the combined support from 20-and-50-day EMA, the altcoin slumps beneath this support, projecting a 5.22% intraday fall.
Key points
- The channel pattern fakeout teases a revisit to last quarter’s bottom support at 100
- The daily-RSI chart slips into the bearish territory
- The intraday trading volume in the Litecoin coin is $907.5 Million, indicating a 14% loss.
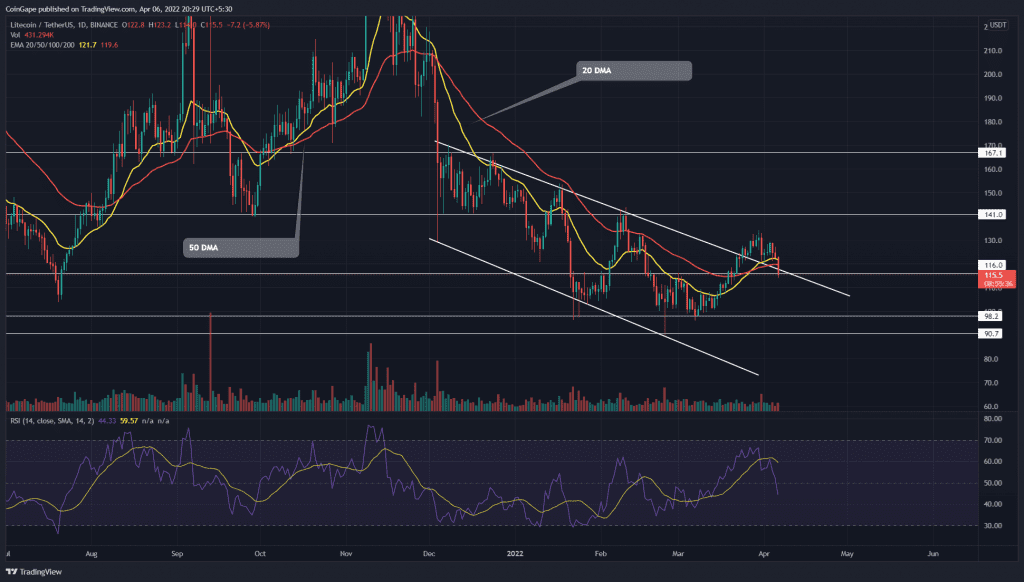
 Source- Tradingview
On March 24th, the (Litecoin)LTC price witnessed a bullish breakout from the falling channel pattern. The breakout rally reached a high of the $134 mark, the highest level since Mid-February. Furthermore, the altcoin pulled back to retest this breached trendline.
The LTC price spent nearly two weeks trying to sustain above the descending trendline. However, today the crypto market experienced a sudden sell-off which plunged the altcoin below the trendline and $116 support.
A successful closing below these support levels may confirm a pattern fakeout, which would intensify the supply pressure. The sustained selling will dump the altcoin to the bottom support at $100.
Contrary to the bullish thesis, if buyers revert the Litecoin price above the breached trendline, the pattern breakout remains intact, and so does the possibility of reaching the $167 mark.
Technical indicator
Due to the current price drop, the LTC buyers lost the 20-and-50-day EMA support. As a result, these EMA lines could flip to possible resistance levels if coin prices sustain this fakeout.
The daily-RSI slope shows a sudden drop below the equilibrium, indicating a bearish sentiment in the market.
- Resistance level- $141 and $153
- Support levels- $116, and $100-$98