The Shiba Inu(SHIB) price recently spilled 15% from the overhead resistance trendline ($0.0000285) as traders continue to respond to a symmetrical triangle pattern. Yesterday( April 6th), the crypto market experienced a sudden sell-off as the largest crypto currency-Bitcoin lost its crucial support of $45000. As a result, the altcoins responded with similar action, and the SHIB price also breached its $0.000025 support.
Key points:
- The symmetrical triangle pattern governs the SHIB/USDT pair
- The daily-RSI indicators surpass their previous swing high
- The intraday trading volume in the Shiba Inu coin is $1.2 Billion, indicating an 18.5% drop.
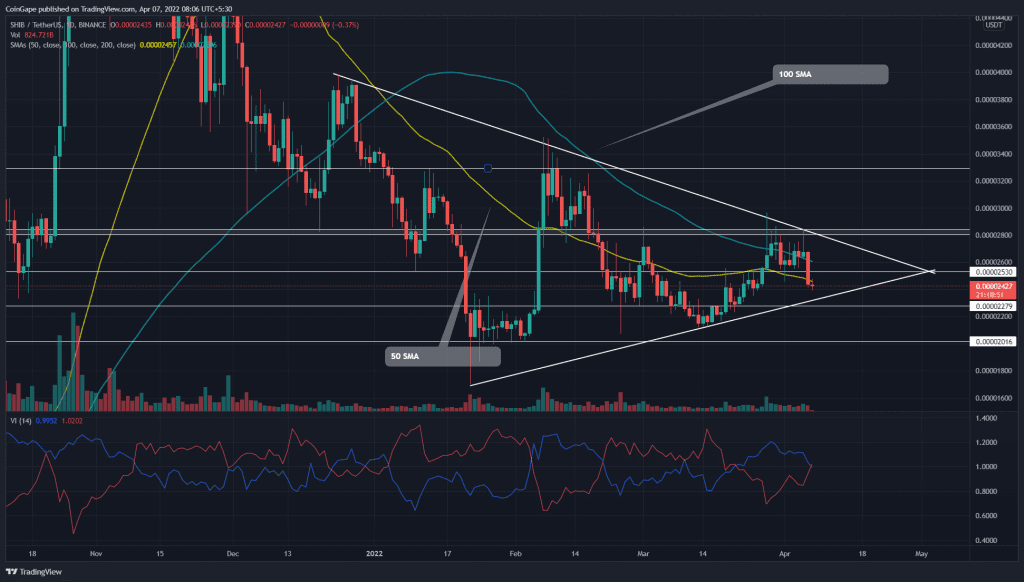
 Source- Tradingview
The uncertainty across the crypto market had confined the SHIB price within a narrow range. The coin price wobbled within the $0.0000285 and $0.00002537 levels for almost two weeks, forming a double top pattern.
Furthermore, the SHIB price gave a bearish breakdown from 0.0002537 neckline support, displaying a 7.32% intraday loss. However, the coin traders respect the symmetrical triangle pattern and may decline another 5%.
If the coin price rebounds from the ascending trendline, the range-bound rally will persist for a few more sessions. A bullish breakout from either converging trendline could kickstart a strong directional move in SHIB.
Technical indicator
SMA-The downsloping 50-and-100-day SMA maintains an overall bearish tendency. Moreover, the coin price has recently nosedived below these EMAs, stimulating additional selling in the market.
Vortex Indicator– A bearish crossover among the V+ and V- slopes provides a sell signal for SHIB traders.
- Resistance levels- $0.0000253, and $0.000028
- Support levels are $0.0000228 and $0.00002