Bitcoin’s price entered into a correction for the past few days and is now down some 5% on the week. In this analysis, we take a look at the major levels to consider going forward.
Technical Analysis
By Shayan
Long-Term – The Daily
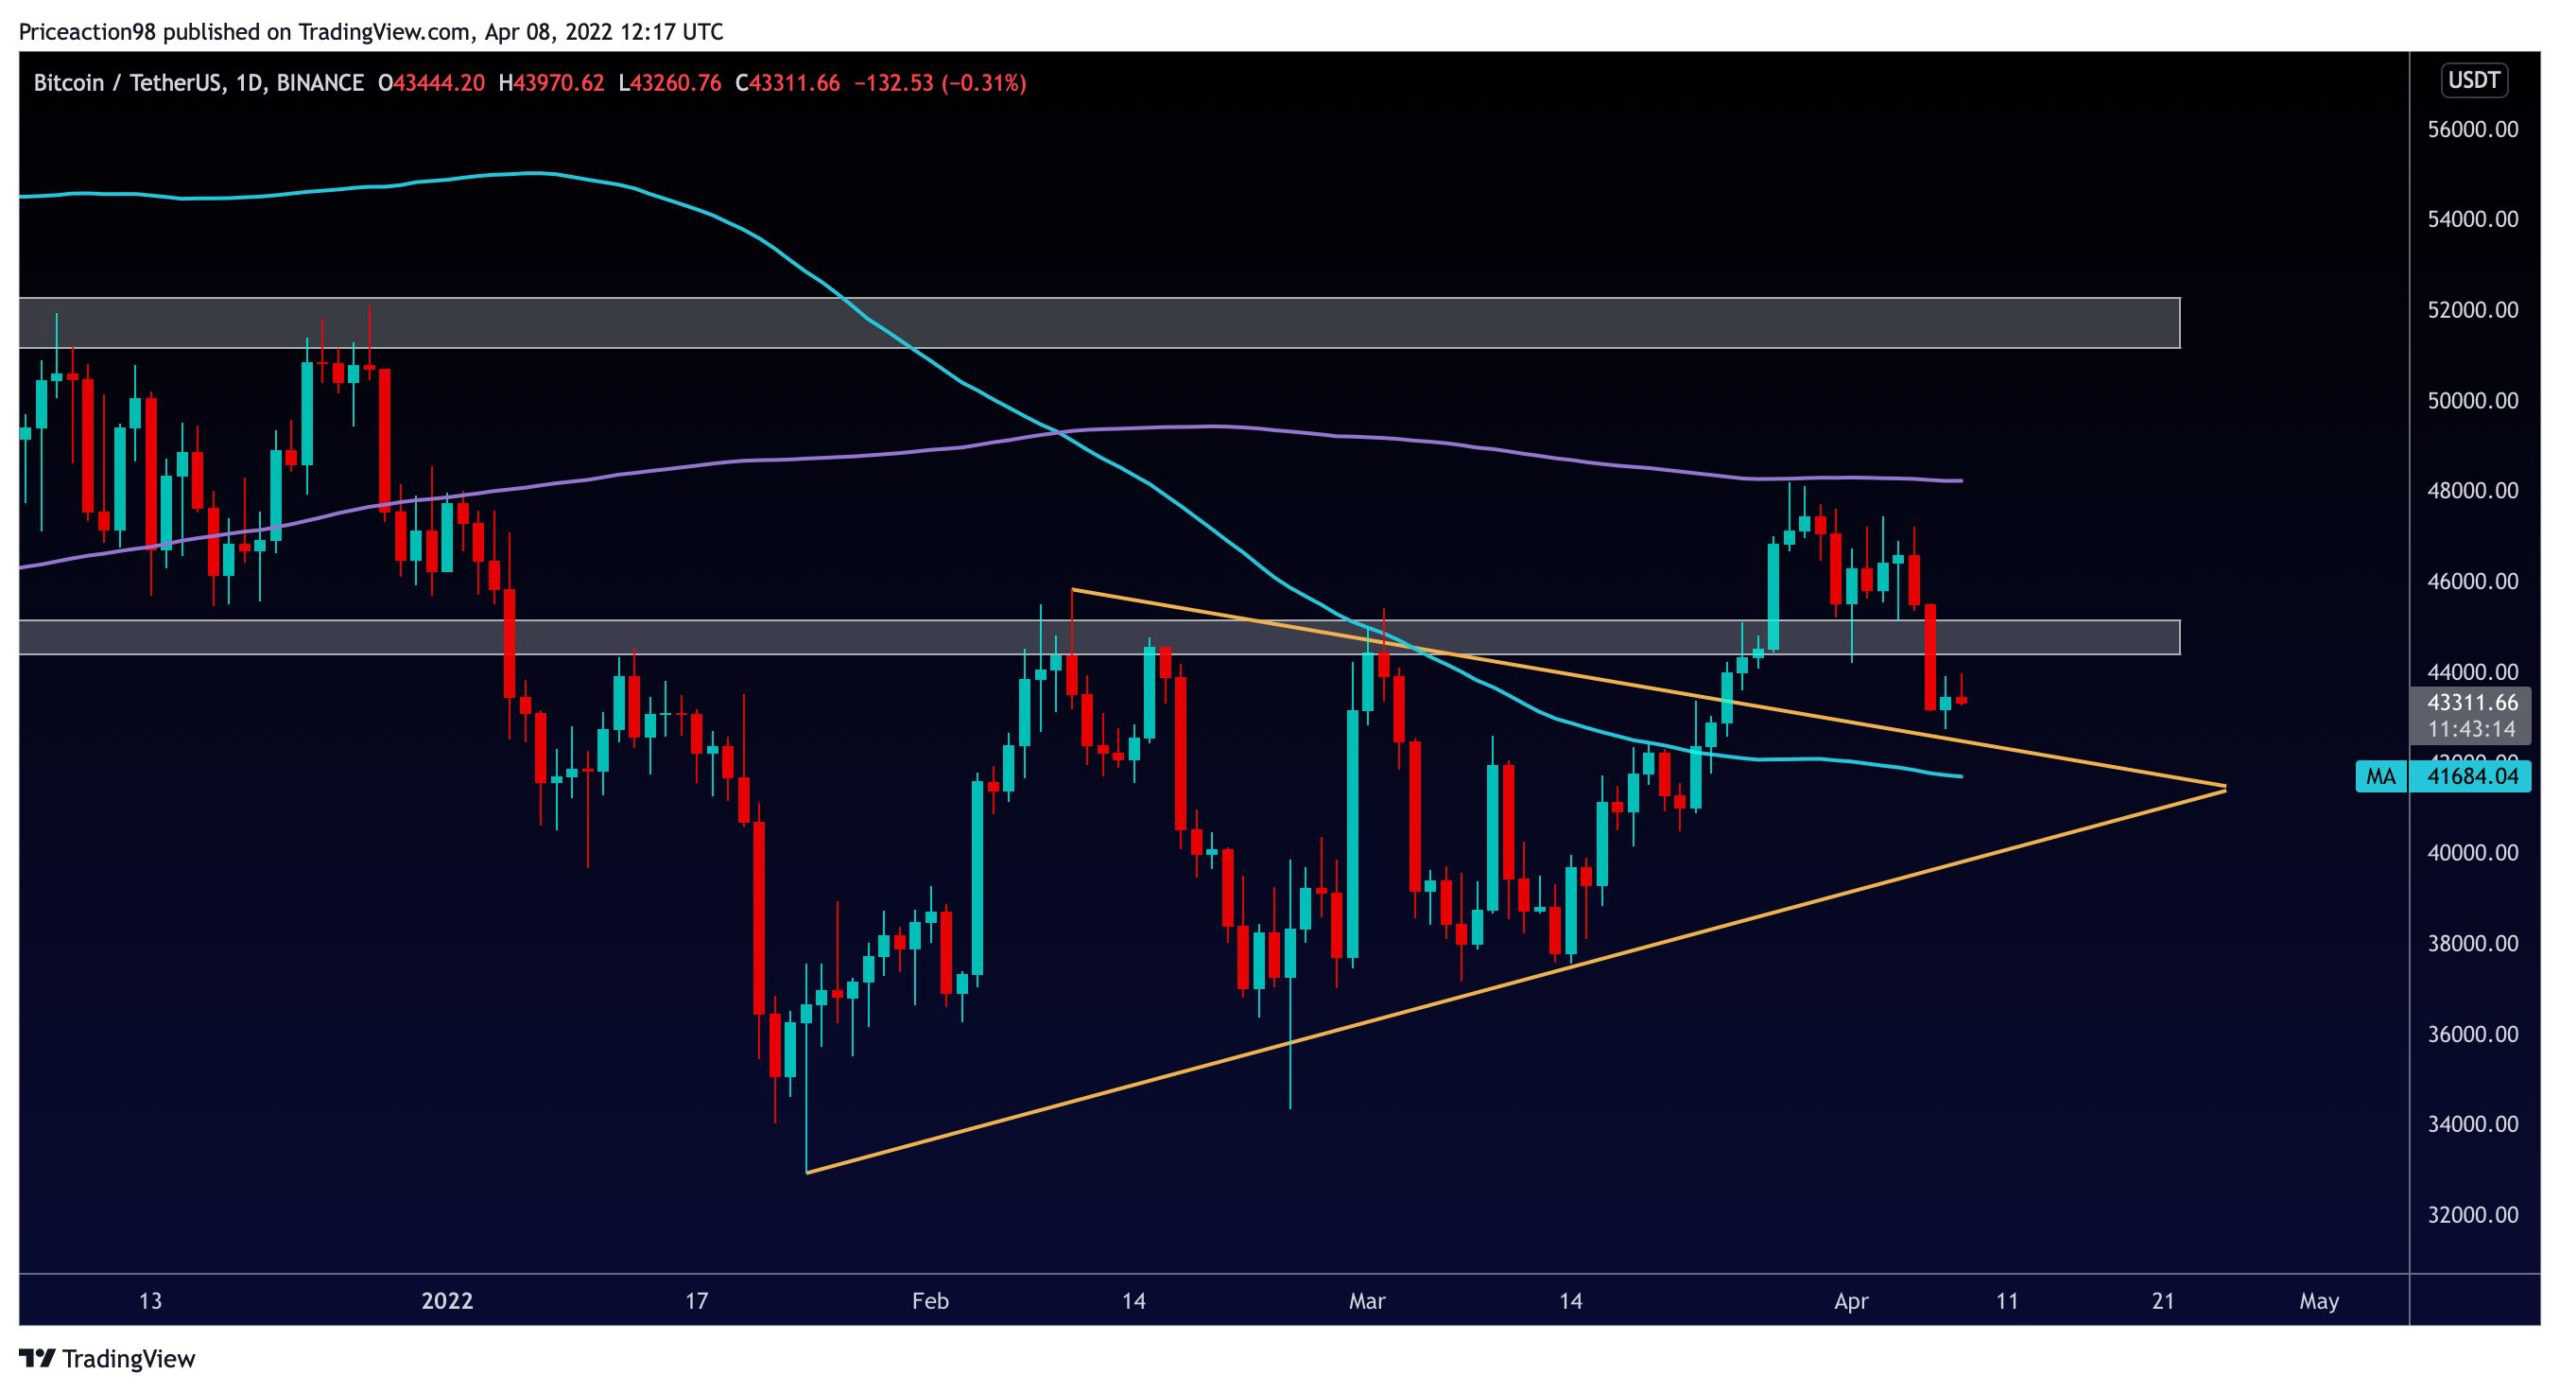
The 200-day moving average has historically served as a reliable support in bull markets and significant resistance in bear markets. As seen on the chart, Bitcoin’s price has reacted to the upper trendline of the bearish flag pattern and the 200-day moving average, and after stabilizing above the broken $46K level for a few days, it has finally been rejected and plunged to lower price levels.
The chart depicts a distinct triangle price action pattern, and BTC has now hit the triangle’s upper trendline. Either it will be supported by the trendline, forming a pullback to confirm another bullish leg, or the price will break below the trendline, attempting to test lower support levels. On the daily chart, Bitcoin has another significant support in the form of the 100-day moving average, which is now at $41.6K.
Short-Term – 4H
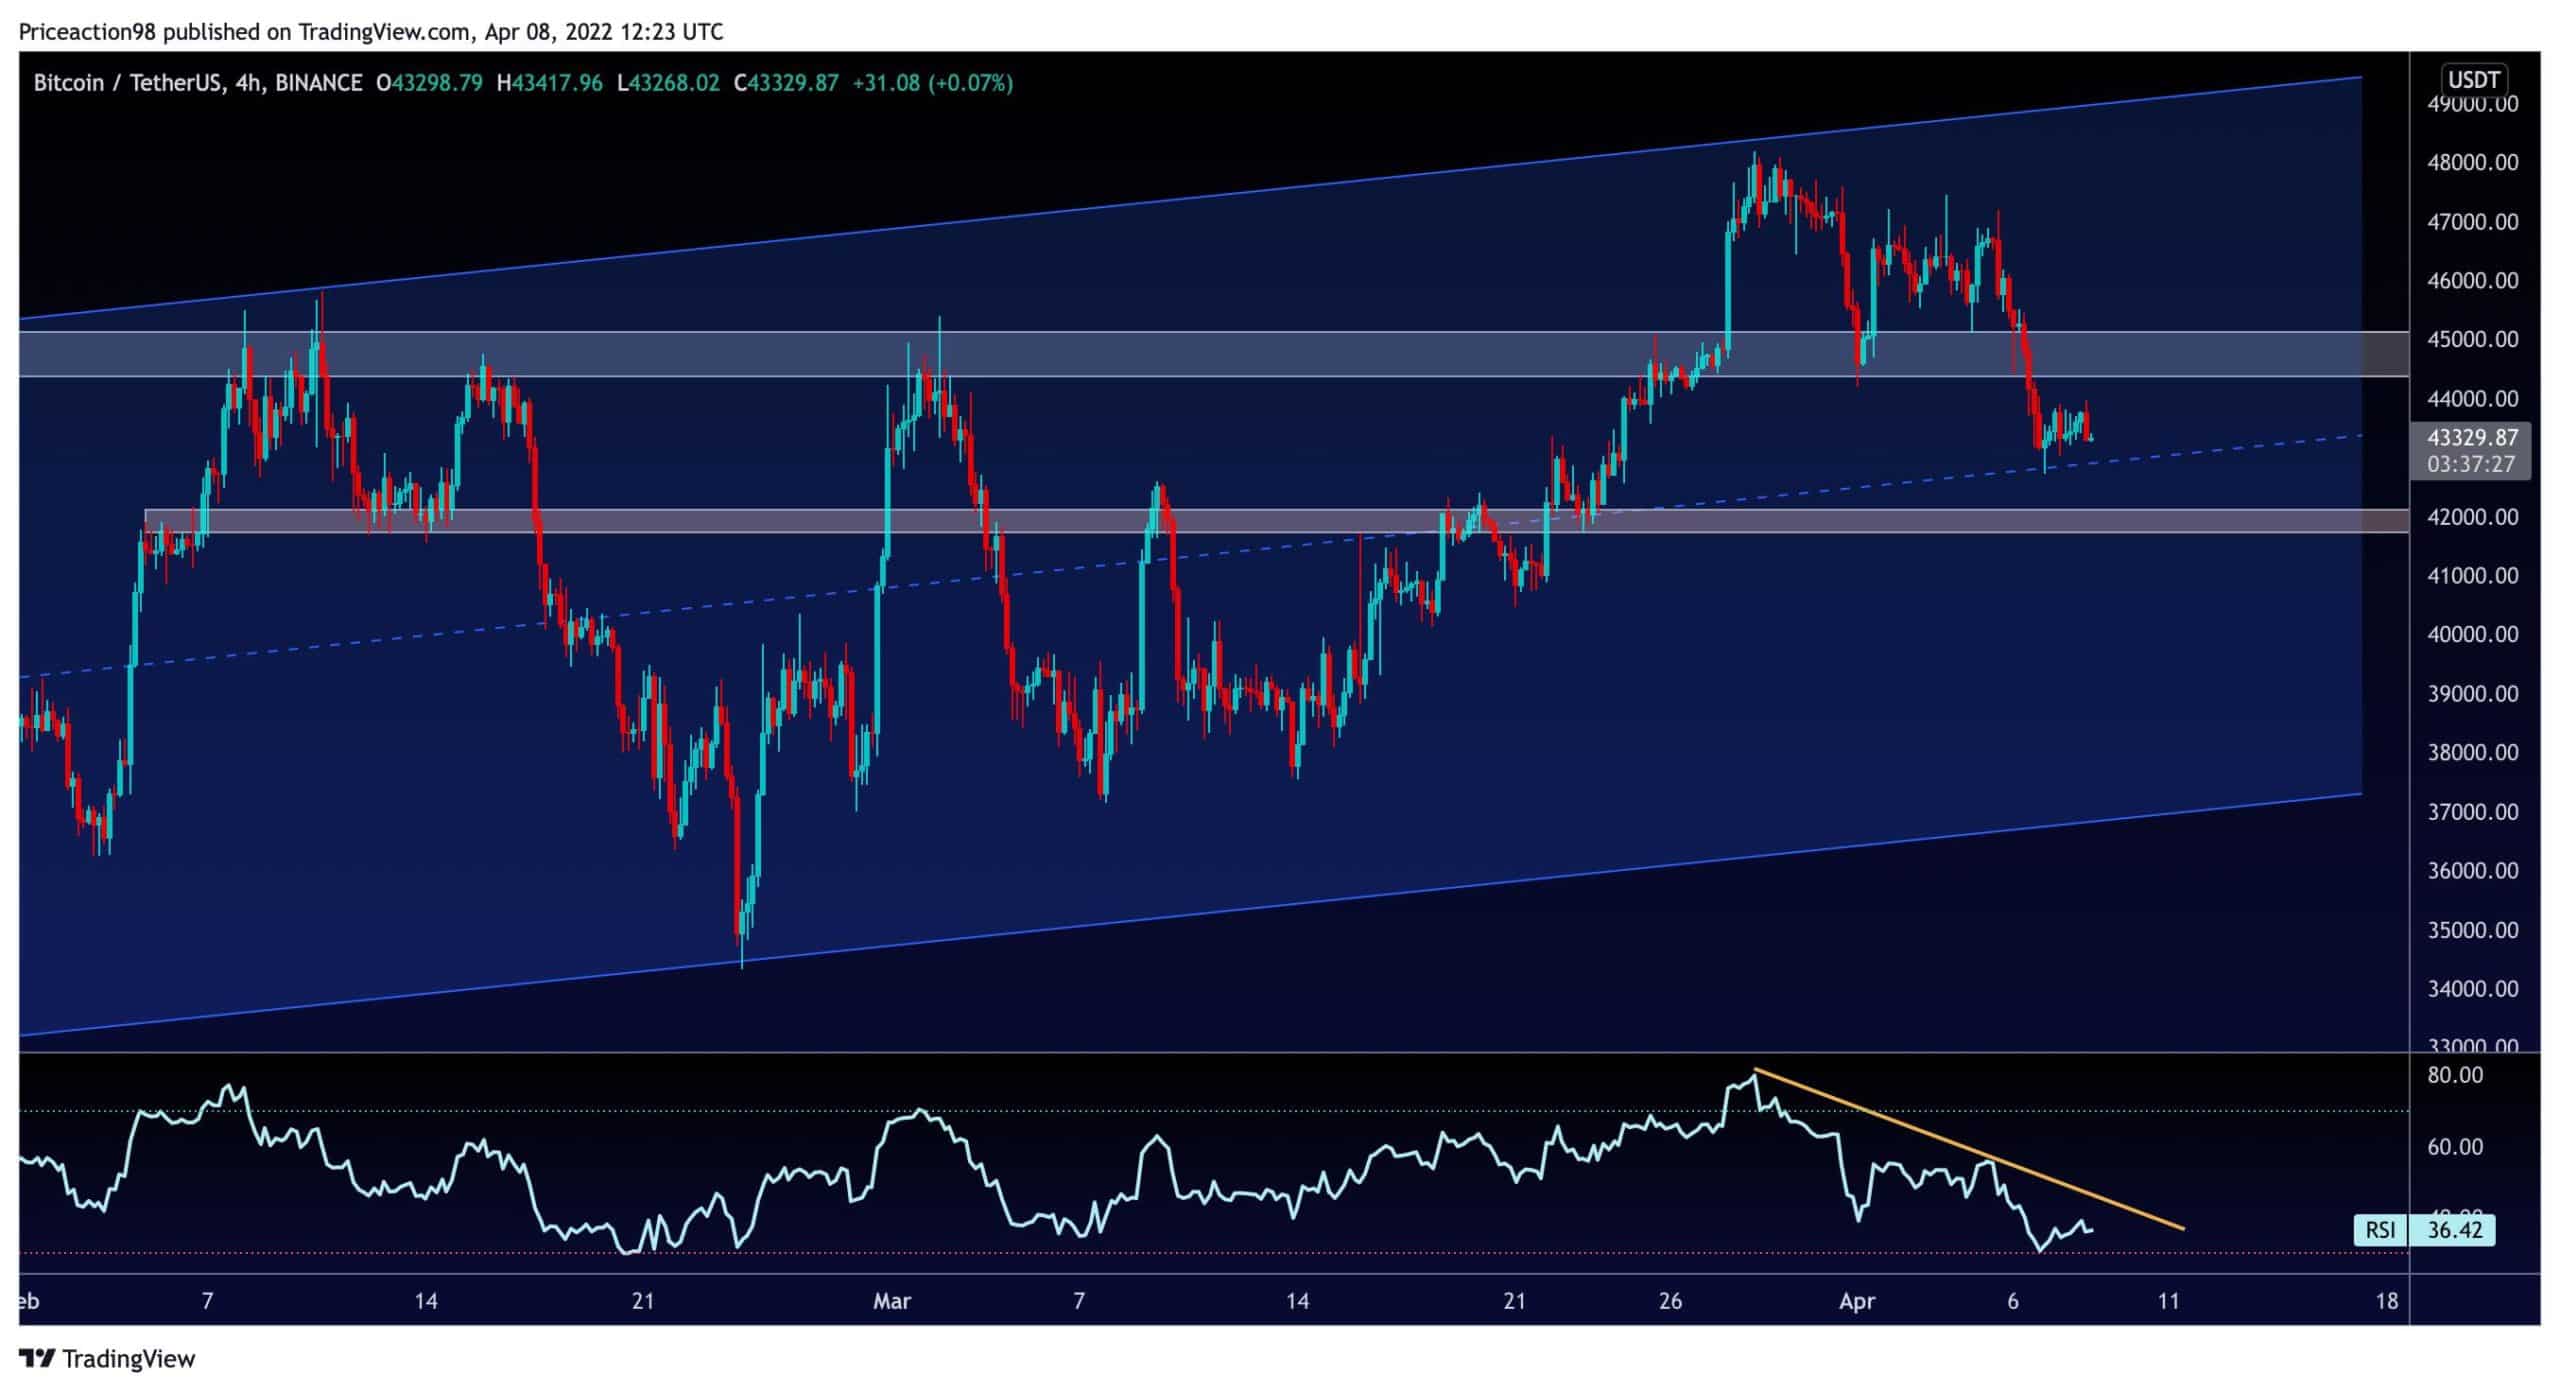
Bitcoin has been rejected from the upper trendline of the mentioned channel on the 4-hour period, plummeting below the $45K mark. Failure to break above the bearish continuation flag pattern might be interpreted as a major bearish signal, implying another collapse and possibly prices below $40,000.
The RSI of Bitcoin, on the other hand, has a multi-day resistance trendline that it must break above if it is to soar to higher price levels. In the short term, the $42K region will be the next level of support for Bitcoin.
On-chain Analysis
By: Edris
Bitcoin Capitalization Models
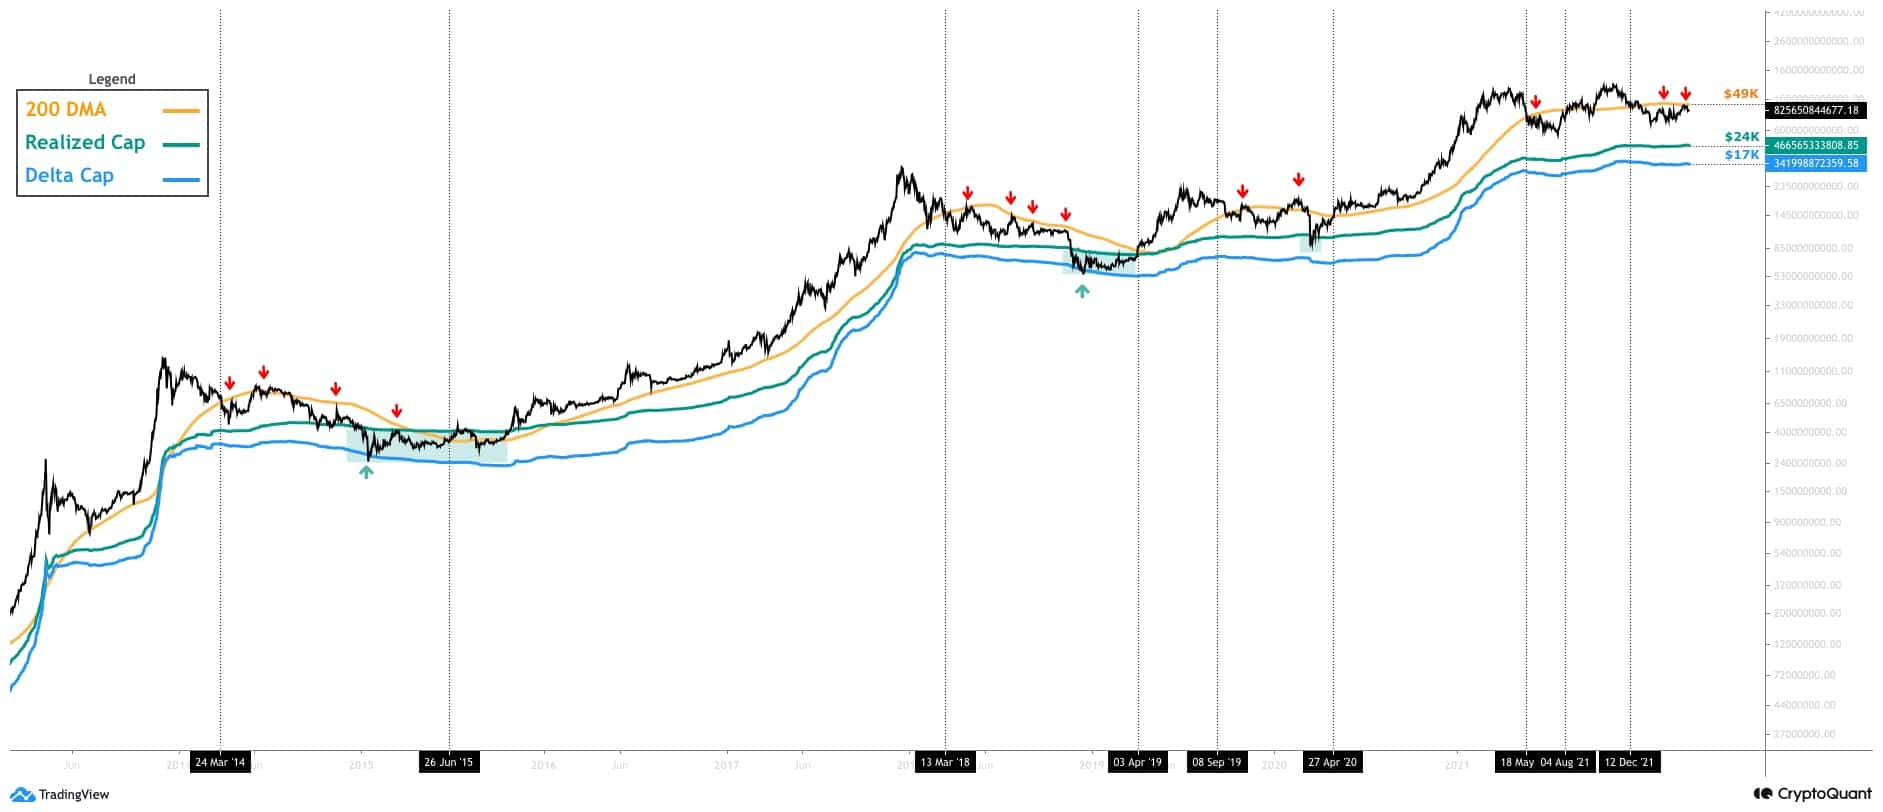
Bitcoin has reached a key level in the past few days, and it is wise to analyze the market from a macro perspective. This chart consists of Bitcoin Market Cap (black) and its 200-day moving average (orange), Realized Cap (green), and Delta Cap (blue).
Historically, the 200 DMA has been reliable support in bull markets and strong resistance in bear markets. Generally, areas above the 200-day moving average are considered a bull market and below it a bear market. The Realized Cap has also been reliable support in the first phase of the previous bear markets. However, it tends to get broken to the downside for the final capitulation, and when the market returns above it, a bull (or mini-bull) market begins. Finally, Delta Cap has marked the absolute bottom of the last two bear markets with great precision.
The market is currently below the 200-day moving average and retesting it again. If this moving average is broken to the upside, the bull market scenario would be on again, and a new all-time high would be probable. However, if the price fails to break above the 200-day moving average, a deeper drop towards the area between Delta Cap and Realized Cap would be expected, similar to previous bear markets. This zone ($17K-$24K) could mark the absolute bottom of a potential bear market.
Binance Free $100 (Exclusive): Use this link to register and receive $100 free and 10% off fees on Binance Futures first month (terms).
PrimeXBT Special Offer: Use this link to register & enter POTATO50 code to receive up to $7,000 on your deposits.
Disclaimer: Information found on CryptoPotato is those of writers quoted. It does not represent the opinions of CryptoPotato on whether to buy, sell, or hold any investments. You are advised to conduct your own research before making any investment decisions. Use provided information at your own risk. See Disclaimer for more information.
Cryptocurrency charts by TradingView.