Last week, the 50-day and 100-day moving average lines went through a bullish crossover; however, Bitcoin failed to continue the bullish momentum and experienced a price shakeout.
Later in the week, the price recovered and made another attempt to break above the moving average lines, but quickly rejected and plummeted below the $40K mark.
Technical Analysis
Technical Analysis By Shayan
The Daily Chart
The next major support for BTC lies in the $36K-$37K region, if this level fails to hold, the price will likely drop to the $30K demand zone.
Also, the RSI indicator is presently below 50 points and the long-term resistance trendline, indicating that the bears have regained control of the market. Bitcoin’s RSI needs to break the descending trendline to reach higher prices.
The next major resistance levels are the 50-day and 100-day moving average lines from the bullish side.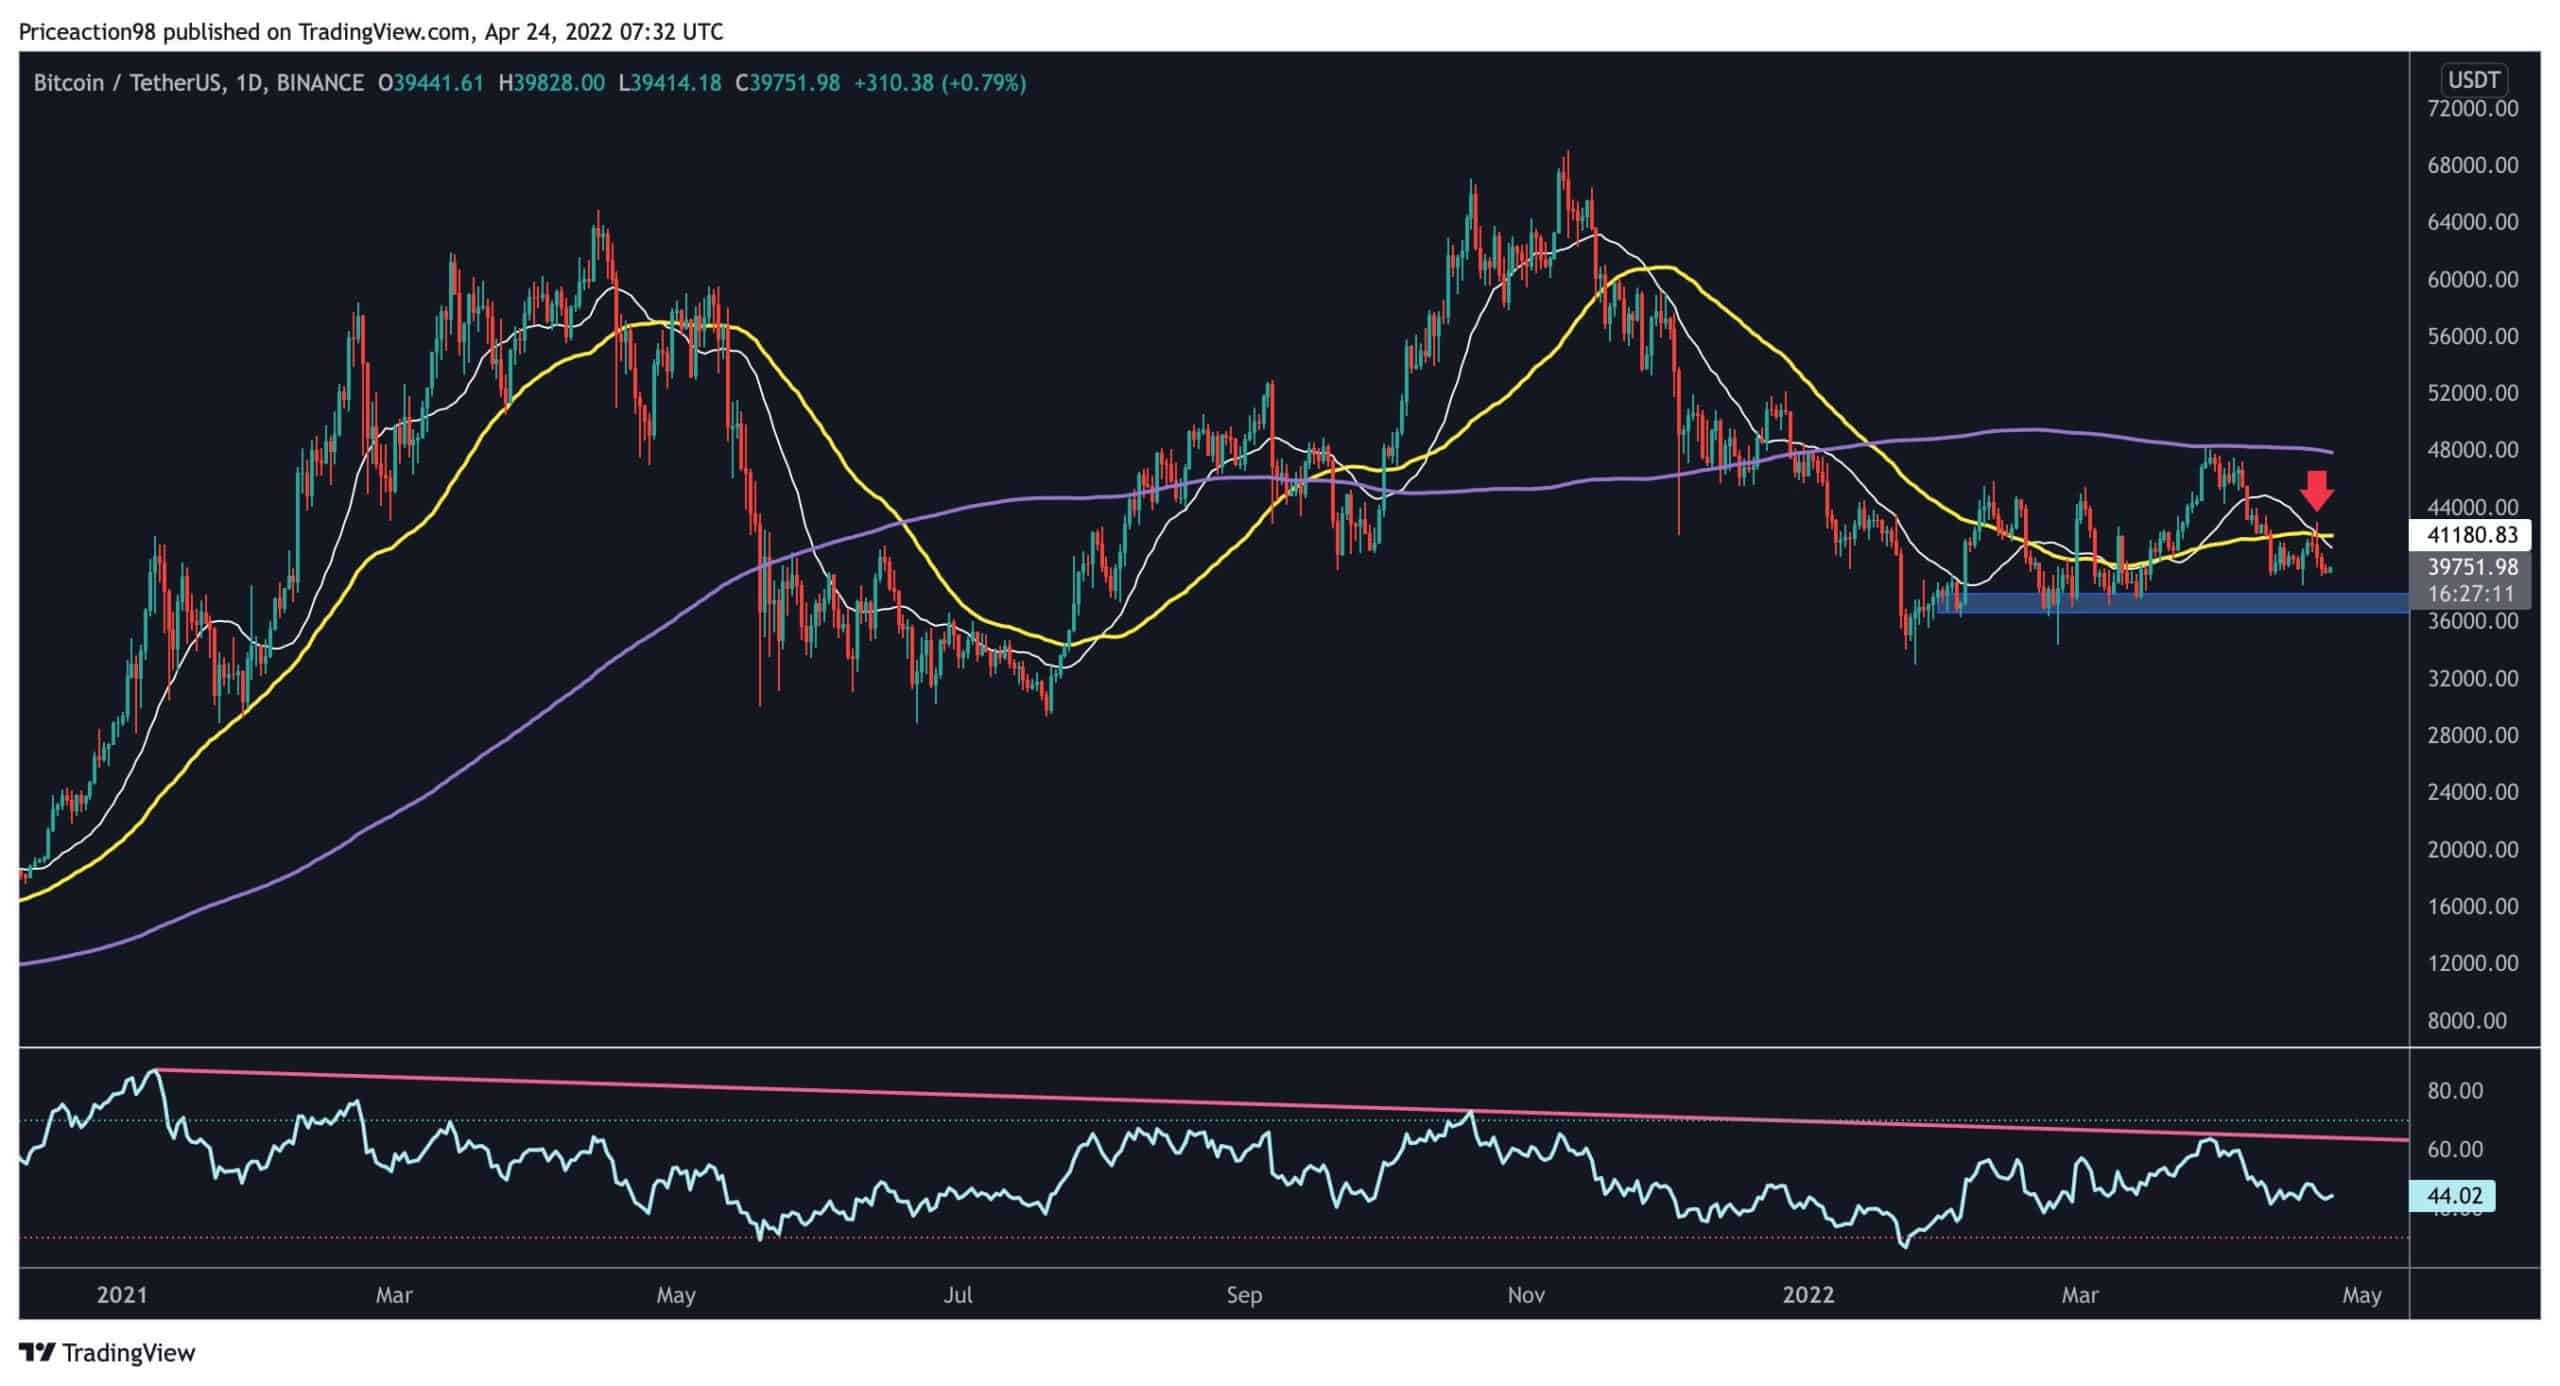
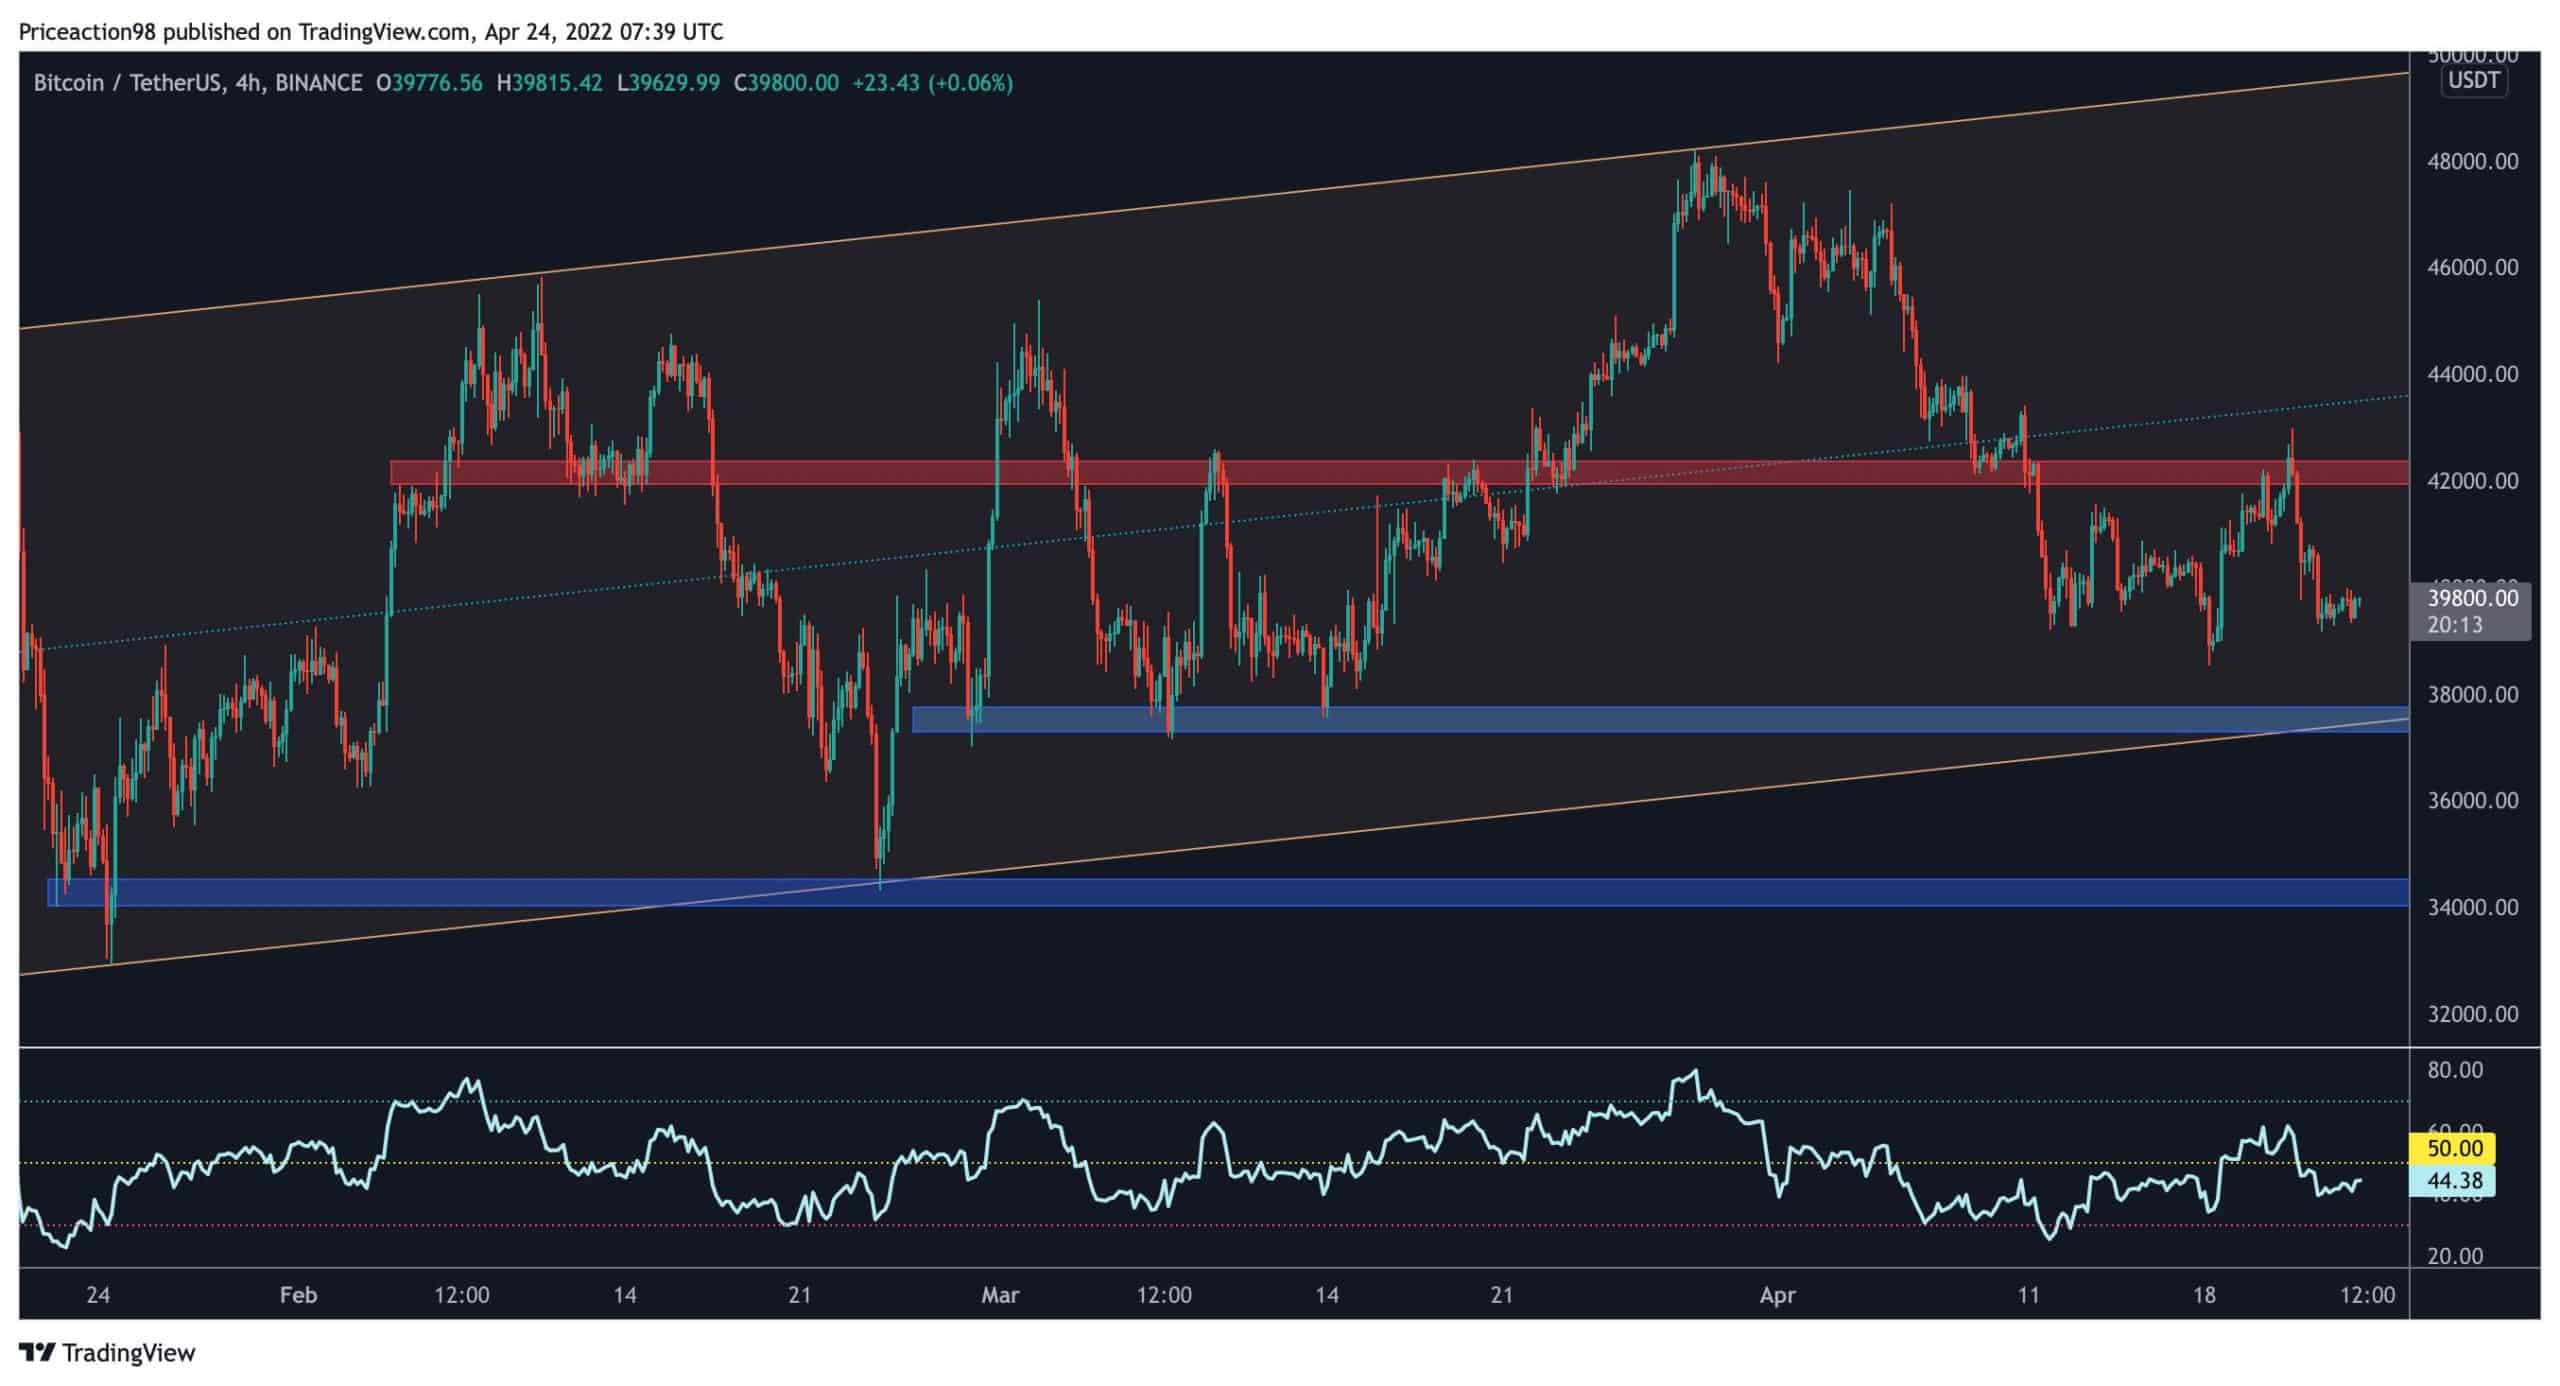
The 4-Hour Chart
The $42K support has turned to a critical resistance level in the lower timeframes after the price failed to break above it. The selling pressure was evident at the $42K level and led to a sudden drop to the $39K zone, which is currently being tested.
Based on what we see now in the market, the bears will probably succeed in pushing the price below the $39K level, but the channel’s bottom trendline and the mid-term support level at the $37K region will be a substantial barrier for Bitcoin. If the mentioned level fails to hold the price above it, dropping to lower demand zones will be imminent.
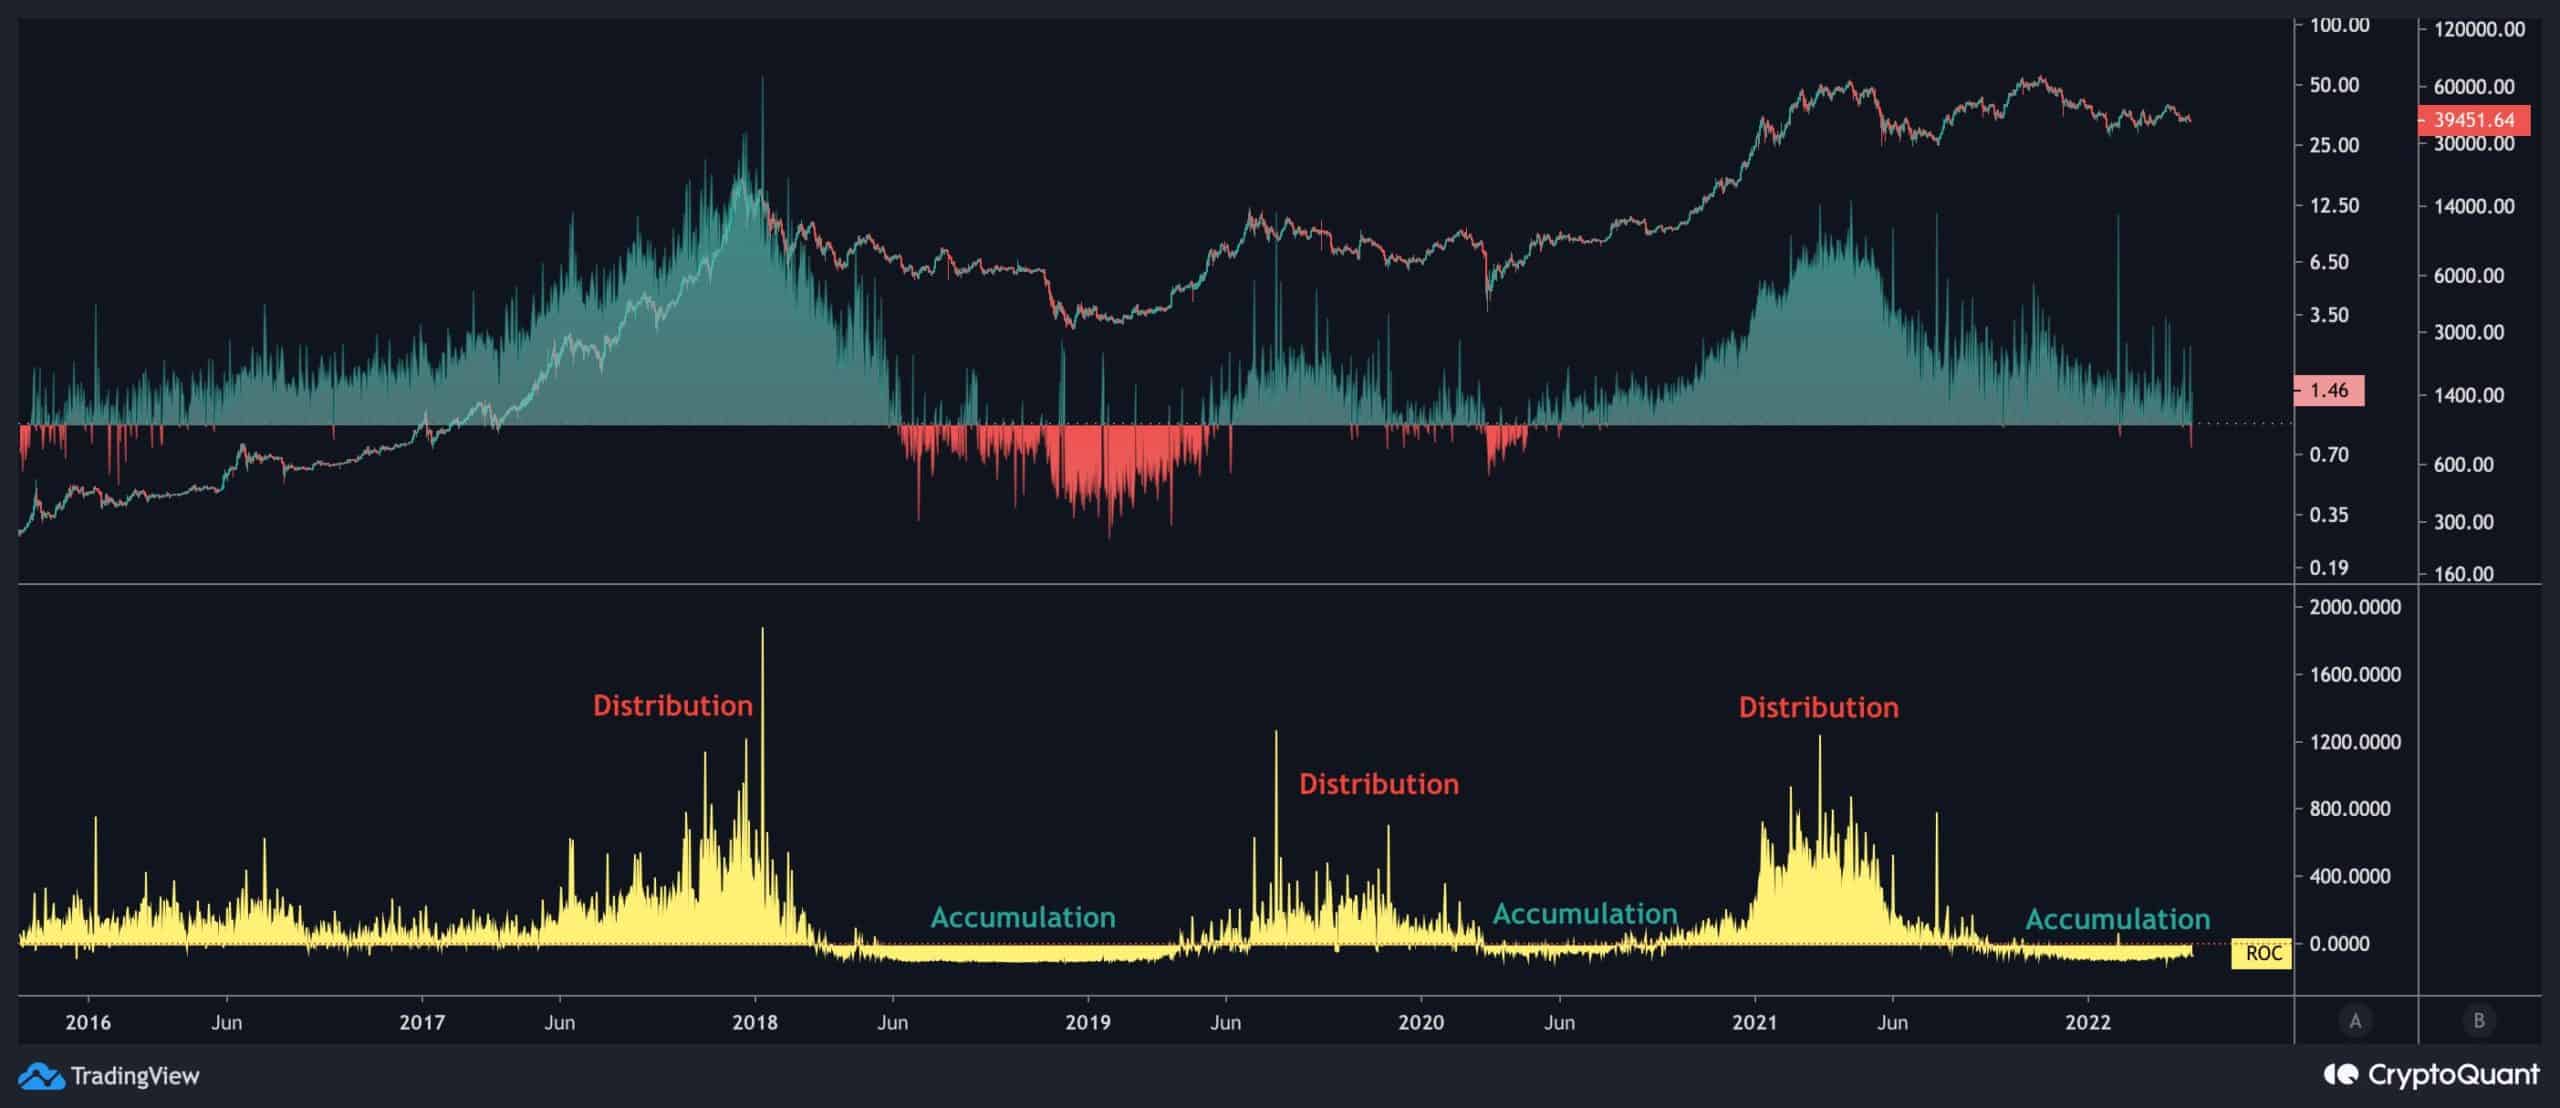
Onchain Analysis
Onchain Analysis By Shayan
This chart consists of the long-term holder SOPR, ROC, and the Bitcoin’s price. The Spent Output Profit Ratio (SOPR) compares the value of outputs at the spent time to the generated time to determine the profit ratio of all market players. You may estimate if the distribution of spent transaction output is in profit or loss.
The rate of change (ROC) in the long-term Holders’ SOPR indicates when these entities are in the accumulation or distribution phases.
For investors who are less sensitive to short-term noise, the market is now under an accumulation phase, when the risk/return rate tends to provide a positive bullish indication for the market direction.
Binance Free $100 (Exclusive): Use this link to register and receive $100 free and 10% off fees on Binance Futures first month (terms).
PrimeXBT Special Offer: Use this link to register & enter POTATO50 code to receive up to $7,000 on your deposits.
Disclaimer: Information found on CryptoPotato is those of writers quoted. It does not represent the opinions of CryptoPotato on whether to buy, sell, or hold any investments. You are advised to conduct your own research before making any investment decisions. Use provided information at your own risk. See Disclaimer for more information.
Cryptocurrency charts by TradingView.