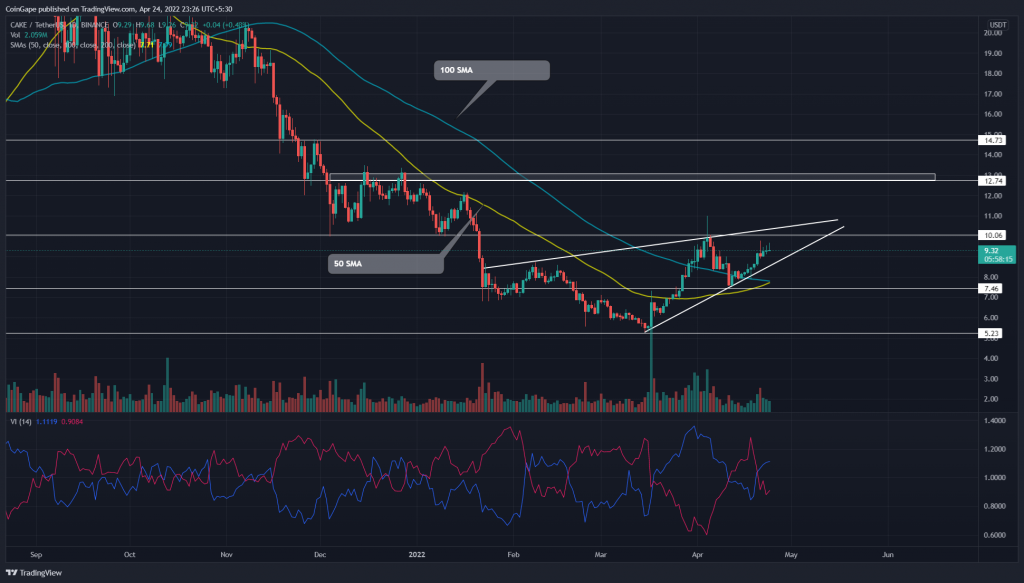

The rising Pancake(CAKE) price is narrowing within a falling wedge pattern. This recovery rally would soon tag the overhead resistance of $10, and a bullish breakout from this ceiling will surge it to $12.74. However, the interested buyers should remain cautious as possible fallout from the wedge pattern remains on the card.
Key points
- The CAKE chart projects the morning star candle in the weekly time frame chart
- The 50-and-100-day SMA is on the verge of giving a bullish crossover
- The intraday trading volume in the CAKE token is $187.7 Million, indicating a 3.93% loss.
 Source- Tradingview
The CAKE/USDT technical chart displays falling wedge patterns in the daily time frame chart. The recent correction from the $10 resistance had discounted the coin price by 30% and plunged it to the 0.618 Fibonacci retracement level.
Furthermore, the CAKE price rebounded from the $7.5 support, suggesting traders’ perspectives have changed from selling rallies to buying dips. The V-shaped recovery has entirely regained the correction phase losses and soared the price by 26%.
The sustained buying will rechallenge the previous swing’s high resistance of $10, indicating a new bull rally is about to begin. If buyers offer a strong breakout and sustainability above $10, the traders can expect the next significant supply zone to be 20% higher at $12.75.
Trending Stories
Currently, the CAKE price trades at $9.35, with an 0.75% intraday gain. However, until the falling wedge pattern is intact, the traders risk a free fall to the March low at $5.23.
Technical analysis
SMA: The rising 50-day SMA is about to cross above the 100-SMA line. This bullish crossover could attract additional buying and bolster the $10 breakout.
Vortex indicator: The instant spread between the VI+ and VI- slope reflects strong bullish momentum.
- Resistance levels- $10, and $12.7
- Support levels- $7.46 and $5.23