
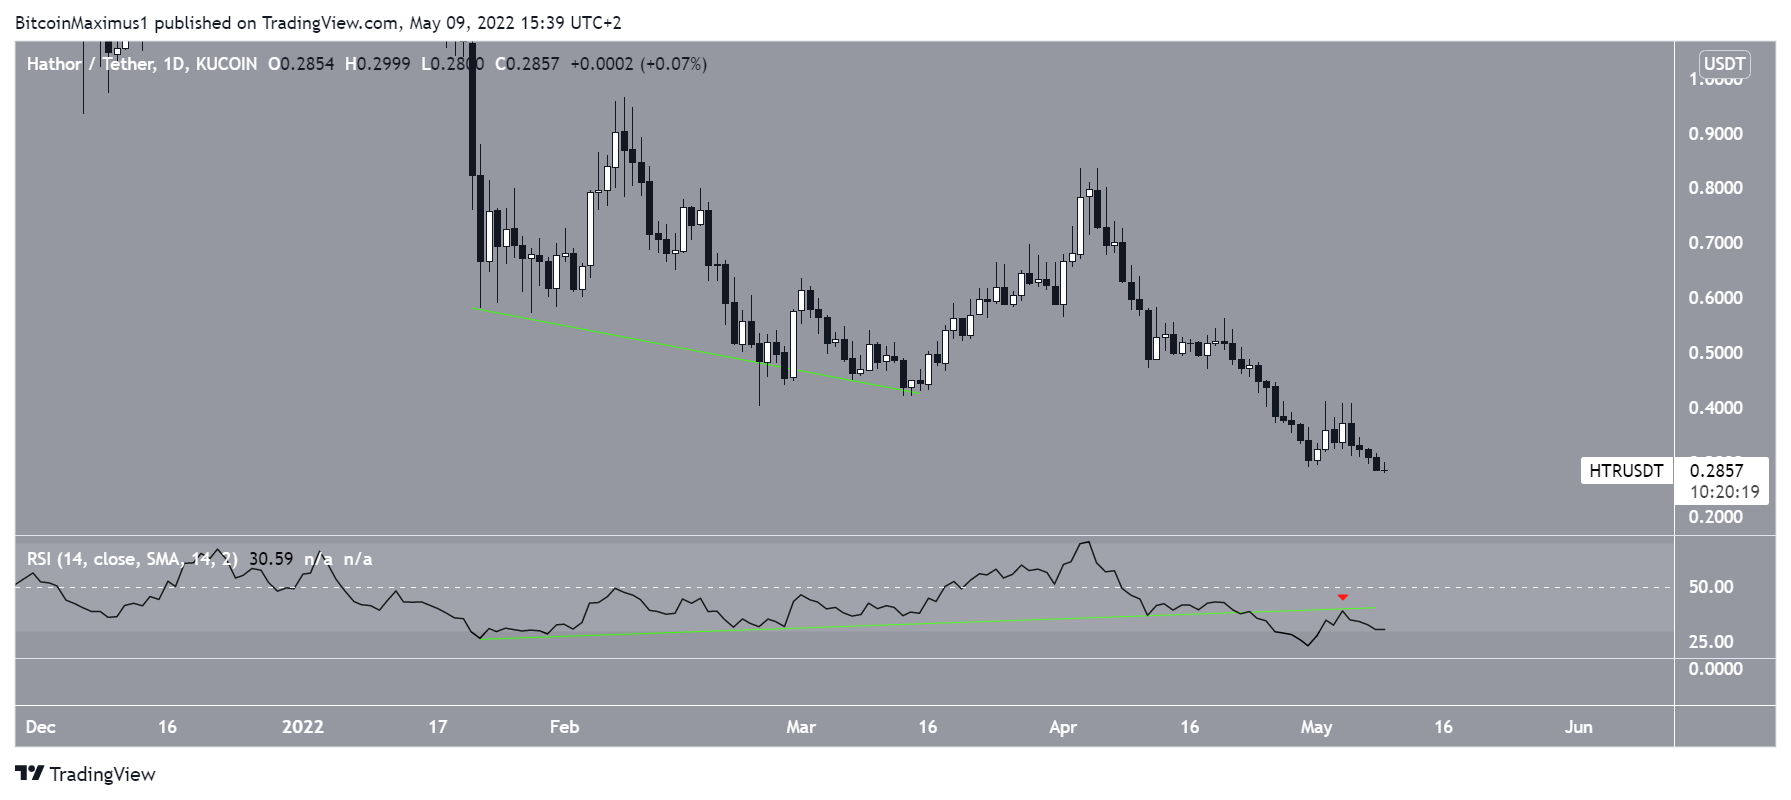
Hathor (HTR) broke down from a long-term ascending support line on April 26. The daily RSI reached a new all-time low four days later.
HTR has been falling since reaching an all-time high price of $2.49 on Nov. 21, 2021. It created a lower high (red icon) on Jan. 4, 2022, before resuming its downward movement at an accelerated rate.
In Feb. and March, the price bounced twice at a long-term ascending support line (green icons). Despite the bounce, it failed to initiate an upward movement and broke down from the line in April. Prior to the breakdown, the line had been in place for 335 days. A breakdown from such a long-term line usually signifies a break in market structure.
On May 9, HTR reached a new yearly low of $0.28. The price is now very close to its 2021 lows at $0.25.
RSI divergence trendline breaks
The daily time frame shows that in the period from January to March, the daily RSI generated considerable bullish divergence (green line).
However, the RSI has fallen below its ascending support line since and validated it as resistance afterward (red icon). This suggests that lower prices are in the horizon for HTR.
While the daily RSI fell to its lowest ever level on April 30, it has yet to generate any sort of bullish divergences. If it manages to reclaim the previous ascending support line, it would lay the groundwork for a potential bullish reversal.
Until then, the trend remains bearish.
Wave count analysis
Cryptocurrency trader @AltstreetBet tweeted a chart of HTR, stating that the correction might be complete.

It is possible that the entire decrease since the all-time high is part of a five-wave downward movement (white). Waves one and three have very similar lengths, so it is likely that wave five will be shorter.
If wave five has 0.382 the length of wave one, HTR would reach a low near $0.26.
A look at the sub-wave count supports this possibility since it suggests that HTR is in the fifth and final sub-wave (black) of wave five.
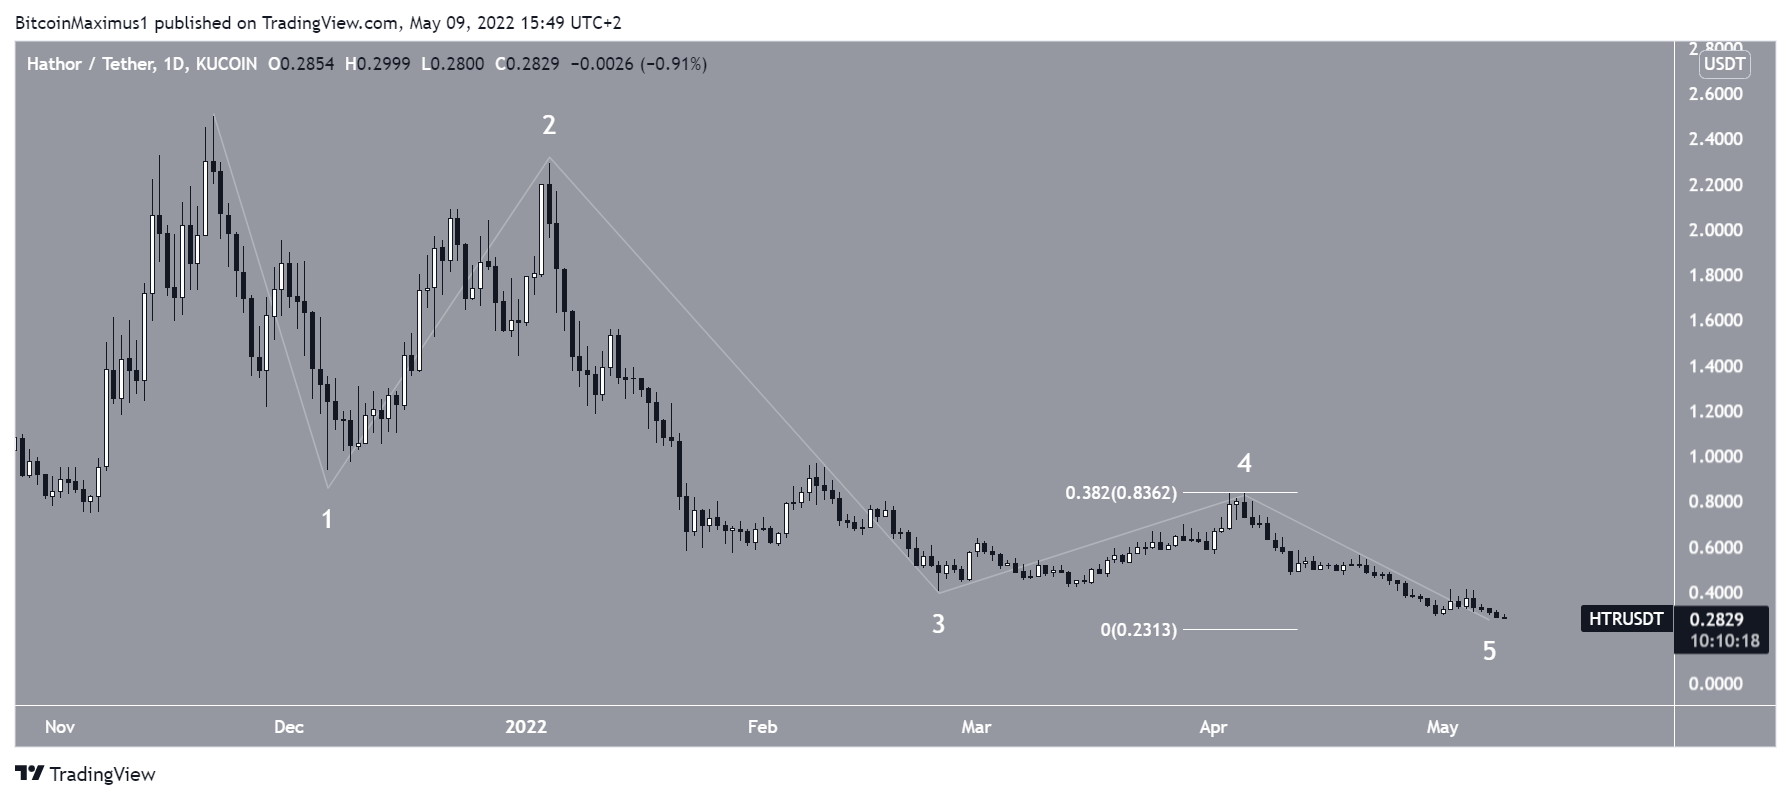
As a result, a significant upward movement would be likely once this correction is complete.

For BeInCrypto’s previous Bitcoin (BTC) analysis, click here
Disclaimer
All the information contained on our website is published in good faith and for general information purposes only. Any action the reader takes upon the information found on our website is strictly at their own risk.