On-chain data shows Bitcoin exchange inflows have continued their recent sharp rise as the price of the crypto drops further.
7-Day MA Bitcoin Exchange Inflow Continues To Point Up
As pointed out by an analyst in a CryptoQuant post, BTC inflows are steeply rising as the selloff in the market rages on.
The “exchange inflow” is an indicator that measures the total amount of Bitcoin being transferred to centralized exchange wallets on any given day.
When the value of this indicator shows an uptrend, it means investors are sending an increasingly higher number of coins to exchanges.
Related Reading | Nvidia LHR Fully Unlocked: “NiceHash” Allows 100% Ethereum Hashrate On RTX GPUs
Such a trend may be bearish for the price of the crypto as holders usually transfer to exchanges for selling purposes.
On the other hand, low values of the indicator show not much selling is going on in the Bitcoin market at the moment.
This kind of trend can be either neutral or bullish for the value of the coin depending on if outflows are low or high.
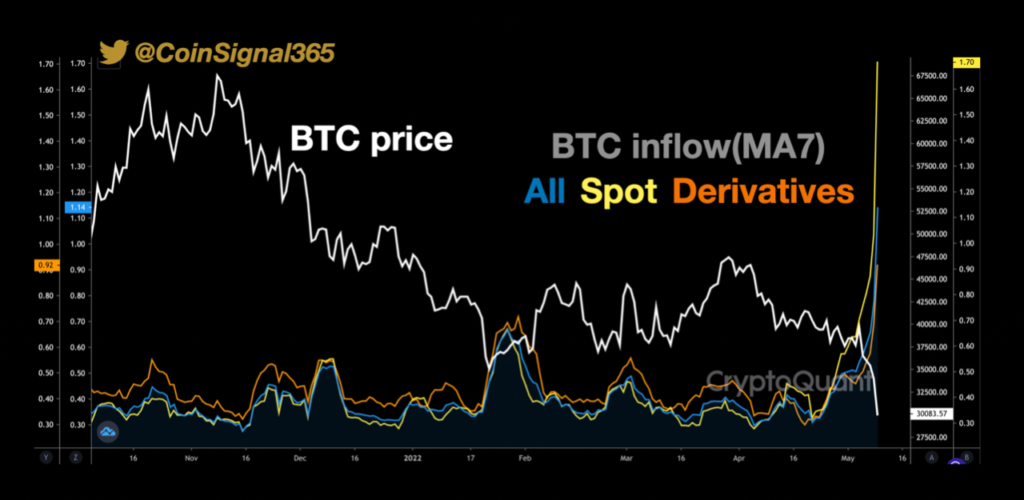
Now, here is a chart that shows the trend in the BTC 7-day MA exchange inflow over the last few months:
Looks like the value of the indicator has shot up recently | Source: CryptoQuant
As you can see in the above graph, the Bitcoin exchange inflow has observed steep upwards movement in the last few days.
The current value of the 7-day MA inflow is the highest it has been since the March of 2020, following the COVID-19 crash.
This shows that investors have been continuously selling their coins as panic takes hold of the market due to the latest drop in the price.
Related Reading | Bitcoin Mining Rigs Could Heat Vancouver Homes Next Year. Take That, ESG FUD
The quant in the post notes that in the past the price has only observed relief when inflows have slowed down and dropped off.
Since the metric still looks to be heading up right now, the value of Bitcoin could see further downtrend in the coming days.
BTC Price
At the time of writing, Bitcoin’s price floats around $31.8k, down 17% in the last seven days. Over the past month, the crypto has lost 26% in value.
The below chart shows the trend in the price of the coin over the last five days.

It seems like the value of the crypto has plunged down over the last few days | Source: BTCUSD on TradingView
Bitcoin price has quickly dropped from $39k all the way down to the current levels within the matter of just a few days.
Earlier today, the value of the crypto even fell down to as low as below $30k, before quickly rebounding back to the current price.
Featured image from Unsplash.com, charts from TradingView.com, CryptoQuant.com