Axie Infinity’s price reveals a bullish intent from a technical perspective, but on-chain metrics present warnings. There is one significant hurdle that could make or break AXS and where it could head. Therefore, investors need to exercise caution with their investments in the coming days.
AXS’s price ready for a move?
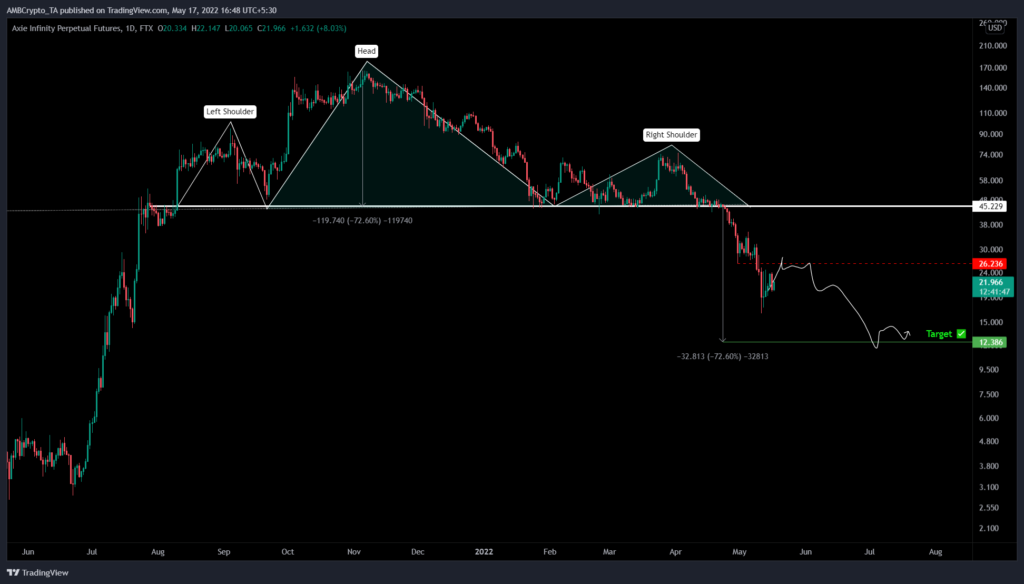
AXS has come a long way since its breakdown from the head and shoulders pattern on 24 April. This technical setup contains three distinctive peaks with swing lows bouncing off a stable support level known as “neckline.”
The central peak is the tallest and is termed the “head,” while the peaks on either side of the head are known as “shoulders” and are of comparable heights. A breakdown of the “neckline” triggers the downswing.
This setup is a popular reversal pattern and usually signals distribution in the asset and represents the end of the trend uptrend. The target is obtained by adding the distance between the peak of the head and the neckline to the breakout point.
Considering AXS breached the neckline on 24 April, the forecast reveals a 72% crash to $12.38. Axie Infinity’s price crashed by 63% in roughly 16 days and set a swing low of $16.22. Since then, the altcoin has recovered by 38% to where it traded at press time – $22.29.
Considering the state of Bitcoin and its bulls, an uptrend seems likely. Therefore, interested investors can position themselves in the same direction for a nice profit. The first hurdle that AXS will face is $26.23. This barrier is an inflection point and could make or break the next leg.
A recovery above this level that flips it into a support floor will indicate a resurgence of buyers. Alas, it is unlikely unless BTC goes on a full-blown rally. A rejection could see AXS continue its downtrend to its forecasted target of $12.38.
Considering the bullish take on BTC, investors can expect Axie Infinity’s price to overcome the $26.23 hurdle and make a run for the next barrier at $45.22.
A bullish bias, but…
While the technicals are definitely showing a bullish bias, the on-chain volume says otherwise. A sudden uptick in this index reveals that investors are interacting with the AXS blockchain. This could serve as a proxy for their investment thesis.
As seen in the technicals, an uptick in this metric is often followed by an uptrend in the asset’s price. Therefore, investors could, in theory, use this as a signal to hop on a trend early to squeeze their profits.
For AXS’s price, however, this metric has been on a downtrend, showing that investors are not interested at its current price levels. In particular, the on-chain volume declined from 1.05 billion to 342 million over the last five days.
This 67% slump represents a lack of optimism among investors. This is a reason why investors should be careful with AXS.