
The KuCoin (KCS) price has significantly recovered within the last three weeks, while some major cryptocurrencies witnessed high volatility. The recovery rally has surged 80% and aims to challenge an important zone at $17.1-$17.5. However, can buyers undermine the bearish crossover of the 100-and-200-day EMAs?
advertisement
Moreover, considering the hot topics in the crypto space, KuCoin has recently added LUNA and LUNC trading pairs to their Isolated Margin trading platform.
Key Points:
- The KCS chart showcased concentrated resistance levels at the $17.1-$17.5 mark.
- The 100-and-200-day EMAs offer a bearish crossover.
- The intraday trading volume of the KuCoin token is $12.3 million, indicating a 53.5% hike.
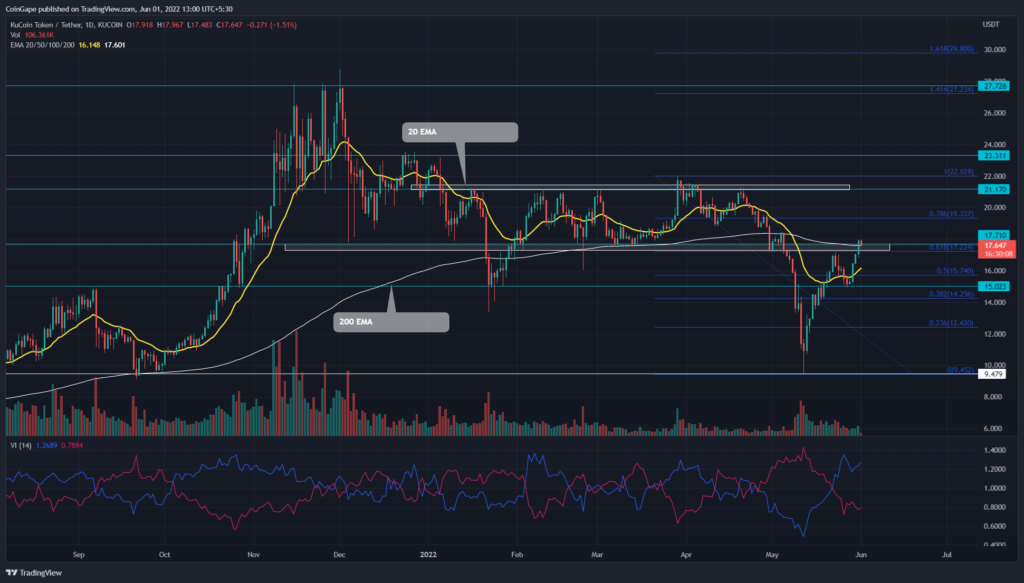
 KCS/USDT Daily Price Chart – Source: KuCoin
On May 6th, the KuCoin (KCS) price provided a confirmed breakdown of the $17.1-$17.5 support zone. Furthermore, losing this monthly support and May 2nd week sell-off intensified the ongoing selling pressure.
Trending Stories
The post-retest fall tumbled the KCS price by 45.5% and slumped it to a low of $9.34. However, this overextended selling couldn’t sustain the price for long, and the rising interest for discounted KCS price triggered a V-shaped recovery.
The recovery rally reclaimed some crucial technical levels like $15, 0.5 Fibonacci retracement level, and 50-day EMA, registering an 80% gain within a fortnight.
It is worth noting that coin sellers attempted to lower the price during May’s 3rd week. However, the KCS price immediately bounced back from the $15 support, indicating the traders are buying on dips.
Furthermore, the post-pullback rally rechallenges the $17.1-$17.5 resistance zone. In addition, the coin chart displays a confluence of major technical resistance concentrated at this level, such as the 0.618 Fib level and the 100-and-200-day EMAs.
A possible bullish breakout and closing above the $17.5 mark would reclaim a significant milestone for KCS recovery, with its next target at $21.2.
Conversely, a failed attempt to breach the overhead resistance would increase the chances of a $15 fallout.
Technical Indicator
Fibonacci retracement level: The KCS price has surged above the 0.5 Fib level and is currently tagged at the 0.618 Fib level. A successful breakout above this level would lower the chances of reversal to the lower level and simultaneously bolster the recovery theory.
advertisement
Vortex indicator: A considerable gap after a bullish crossover of VI+ and VI- slopes reflects a rise in underlying bullishness.
- Resistance levels– $17.1-$17.5 and $19
- Support levels– $16, $15