Disclaimer: The information presented does not constitute financial, investment, trading, or other types of advice and is solely the writer’s opinion.
In June, Bitcoin posted a low of $17.8k on the charts. In July, Bitcoin followed that development up with a higher low formed at $18.7k.
Over the past month, Bitcoin has continued to set higher lows. Just as importantly, the price also broke the $22k barrier earlier this month.
This broke the bearish market structure in a medium time frame and set up a path for Bitcoin to push higher. Theta Network’s token has traded within a range while Bitcoin moved higher.
However, in the past couple of weeks, THETA showed bullish intent as it rose above the $1.3 mark.
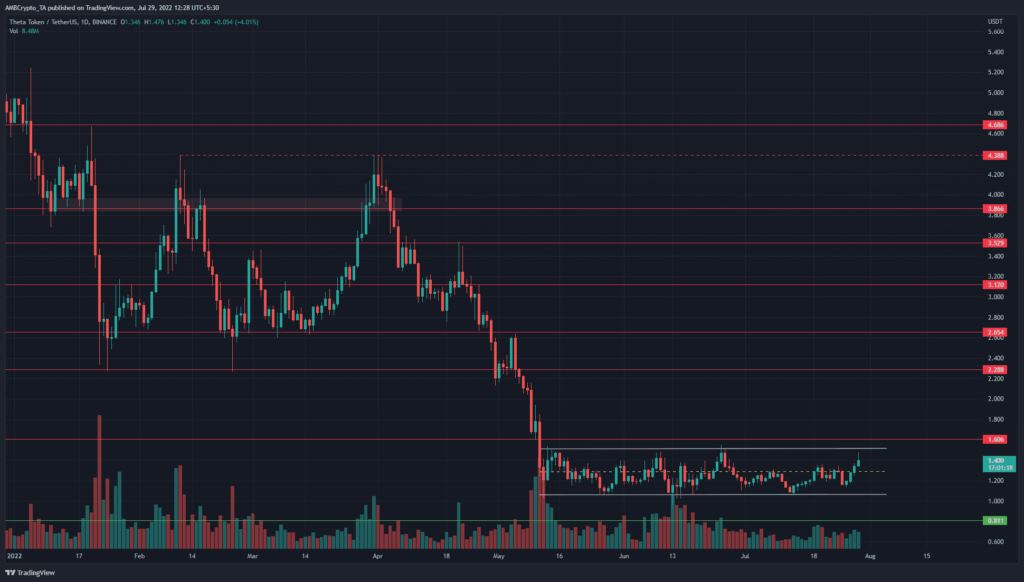
THETA- 1-Day Chart
On the daily timeframe, it was clear that THETA was in a strong bearish trend, especially in April and May. In June and July, the price was able to form an accumulation pattern, a rectangle bottom, between $1.06 and $1.51. The mid-point of this range lay at $1.29.
The range pattern’s highs and lows were respected as resistance and support since mid-May. The mid-point of the range has also acted as crucial resistance on multiple occasions. Therefore, a retest of the mid-range mark could offer a decent buying opportunity targeting $1.5-$1.55.
THETA- 4-Hour Chart

Source: THETA/USDT on TradingView
On the 4-hour chart, the past few days have seen a wild THETA pump from $1.15 to $1.45, before a quick rejection at the most recent trading session at press time. During this timeframe, THETA had a bullish outlook. It targeted the range highs at $1.5.
It must be remembered that a good chunk of this move has already played out. Yet, profitable trades can still be found for THETA over the next few days. The entire area from $1.35-$1.3 can be expected to act as support.
Therefore, upon a pullback, a relatively low-risk long trade can be entered, with a stop-loss below the $1.23-$1.25 zone.

Source: THETA/USDT on TradingView
The moving averages were on the verge of forming a bullish crossover. The 21-SMA (orange) was just beneath the 55-SMA (green) and climbing on the price chart.
The RSI reached overbought territory as well when THETA reached resistance at $1.45-$1.5. This forced a pullback, but the buying pressure was not yet halted.
The CMF was well above the +0.05 mark to highlight heavy capital flow into the market. The OBV has also climbed in the past week. It set higher lows alongside the price during the past three weeks as well. This finding showed steady demand behind THETA’s rally from the $1 level.
Conclusion
The volume indicators showed a good amount of buying was present behind the strong surge higher for THETA.
Momentum also continued to favor the bulls. The $1.35-$1.3 zone can be monitored to enter long positions, targeting a move to $1.5.
If Bitcoin can break past $24.5 and reach the $26k resistance, a move as high as $1.6 could also materialize.