In the last days of July, the bears seized the opportunity and put a halt to the rally that started two weeks ago. This resulted in the monthly candle closing with long wicks, which signifies the battle between the bears and the bulls inside the range of $1,350 to $1,800.
The ongoing disputes between China and Taiwan have also eased the investors’ appetite for risk.
Technical Analysis
By Grizzly
The Daily Chart
The bulls failed in their first attempt to break the resistance at the $1,700-$1,800 range (in red). After several hits at the 100-day moving average line (in yellow), the bears finally pushed the price down 12% from last week’s high ($1,784).
The upsloping 20-day moving average (in white) is considered the first support ahead of the price, which lies at $1528. If ETH breaks below that, the next stop is at $1350, the latest low during the recent bullish leg was formed. This is an important support to watch out for because failing this level invalidates the bullish structure.
At the moment, due to the geopolitical tensions in Asia, high-risk assets are not very attractive to investors. In this case, until the bulls can push the price above the resistance zone, it is not expected to see a significant upward movement.
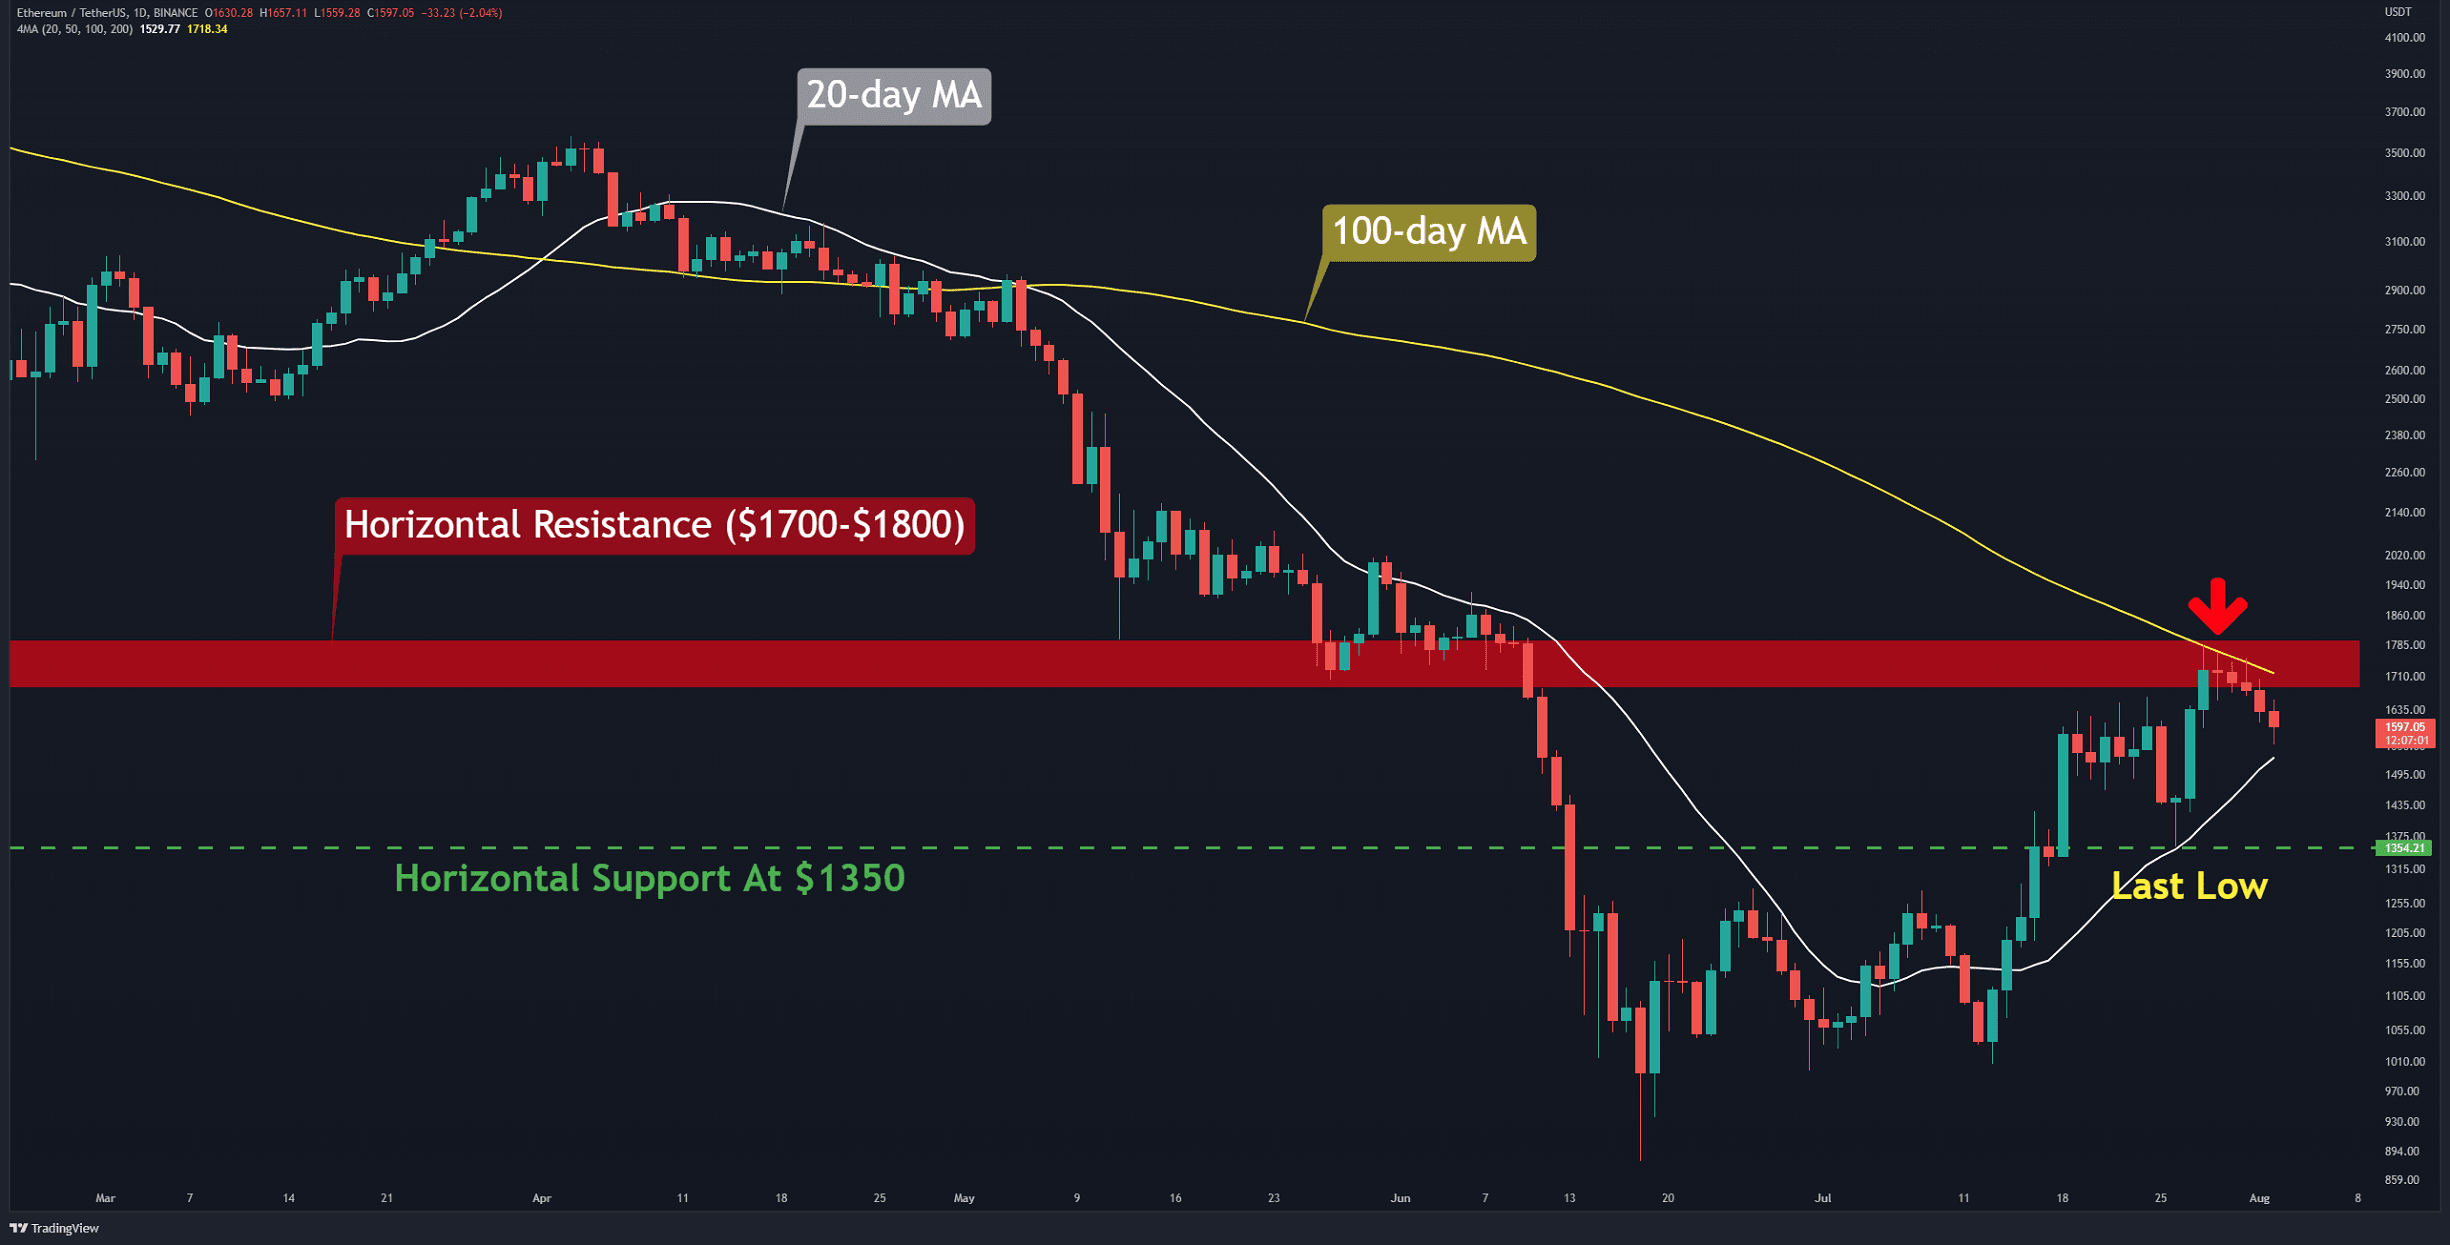
Key Support Levels: $1500 & $1350
Key Resistance Levels: $1800 & $2170
Daily Moving Averages:
MA20: $1528
MA50: $1293
MA100: $1718
MA200: $2318
The ETH/BTC Chart
The recent bullish sharp trend was stopped by hitting the horizontal resistance at 0.073 BTC (in red). Short-term traders are expected to book profits around this level, which is part of the reasons for the correction over the past couple of days.
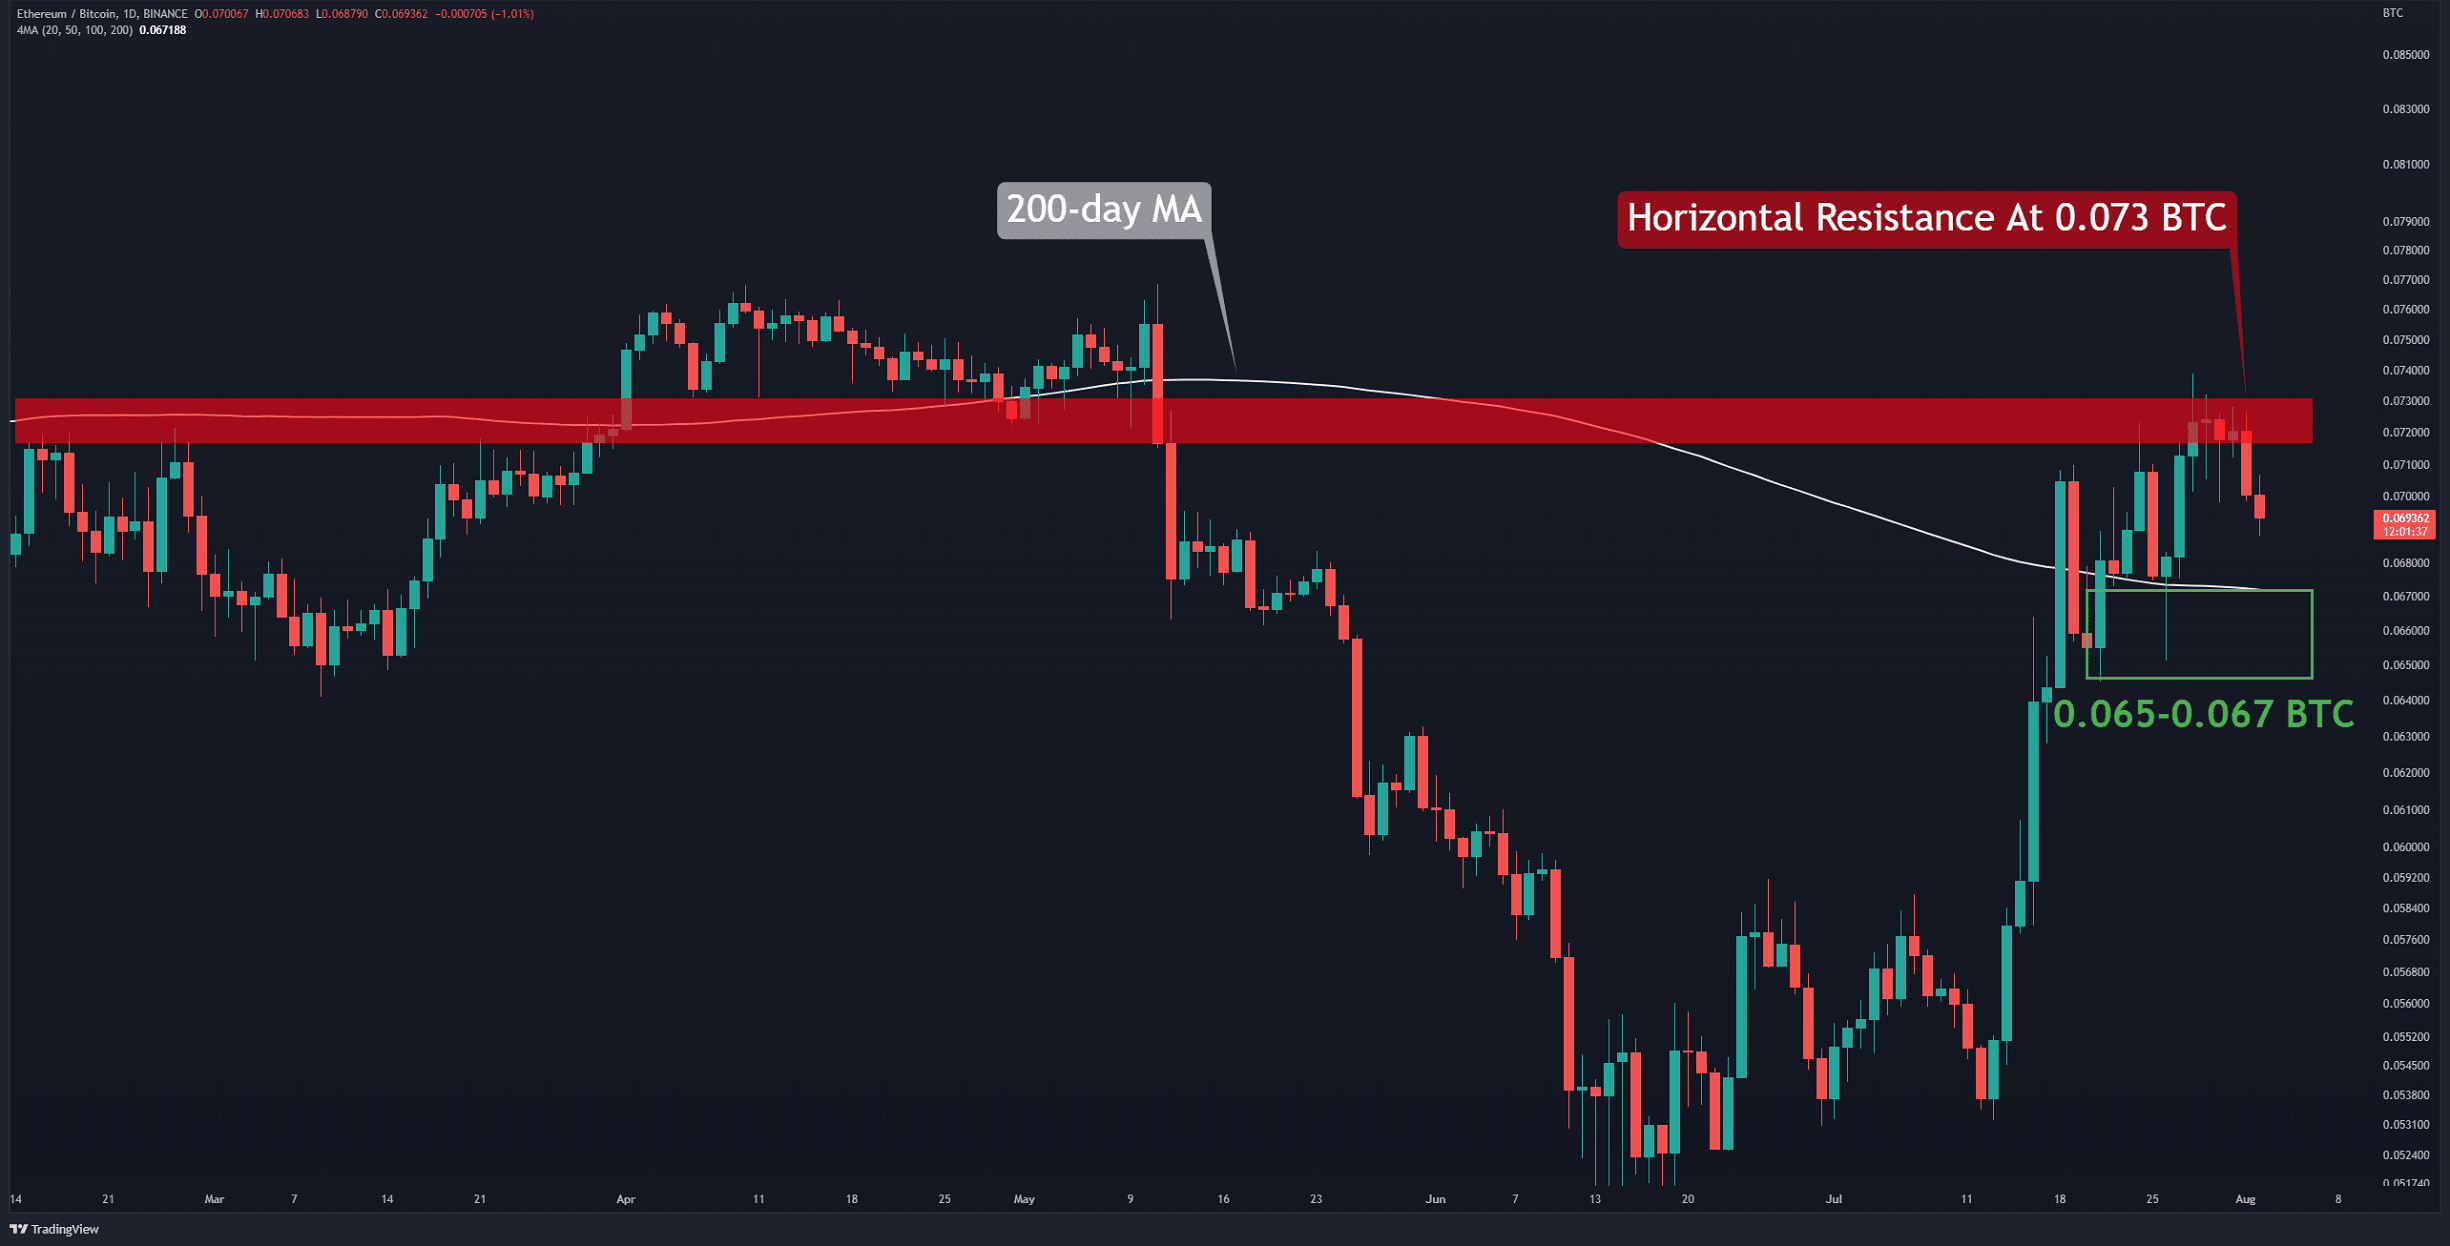
The first support zone in this chart is in the range of 0.065 to 0.067 BTC (green rectangle), which overlaps with the 200-day moving average (in white). The bullish structure remains valid if the ETH price against BTC is above this zone. If the bulls support this level, the red resistance zone is expected to be tested again.
Key Support Levels: 0.065 & 0.06 BTC
Key Resistance Levels: 0.073 & 0.078 BTC
Binance Free $100 (Exclusive): Use this link to register and receive $100 free and 10% off fees on Binance Futures first month (terms).
PrimeXBT Special Offer: Use this link to register & enter POTATO50 code to receive up to $7,000 on your deposits.
Disclaimer: Information found on CryptoPotato is those of writers quoted. It does not represent the opinions of CryptoPotato on whether to buy, sell, or hold any investments. You are advised to conduct your own research before making any investment decisions. Use provided information at your own risk. See Disclaimer for more information.
Cryptocurrency charts by TradingView.