Published 12 mins ago
The Solana price analysis indicates that the upside momentum is intact as the ninth largest cryptocurrency meets the critical resistance near $49.0. The buyers have been continuously participating since the being of the week as gained 19% so far.
advertisement
A sustained buying pressure could push the price to test the levels last seen in May.
- Solana’s price edges higher for the fifth consecutive session.
- The bullish formation on the daily chart suggests more gains could be entertained in the cryptocurrency.
- A daily candlestick below $45.0 could invalidate the bullish outlook.
Solana price consolidates

On the daily time frame, the Solana price analysis exhibits bullish moves. The price is trading in a rising channel, but something different is happening inside that channel.
Earlier, the price was making higher lows, with lower highs, indicating accumulation with a slight contraction in the price. However, in the previous session, the price witnessed a breakout of the “Symmetrical triangle” pattern, along with the “Volume Contraction” Pattern.
Trending Stories
The key to this pattern is that there needs to be a contraction of volatility as the chart moves from the left to the right. This highlights that the volume available is decreasing and becoming scarce. In addition, the more dramatic in volume, the more likely that the move will be explosive. Above the breakout is accompanied by an increase in the relative volume.
According to the above pattern, The expected first target for the buyers would be high of May 25 at $50.50 followed by the $60.0 psychological level.
The RSI(14) is trading above 60, indicating that the average gain is more significant than the average loss, you can conclude that it’s in an uptrend and can place buying orders with proper stop-loss.
On the other hand, if the price closes below the session’s low then a corrective pullback is expected. The bears could test the $42.0 support level.
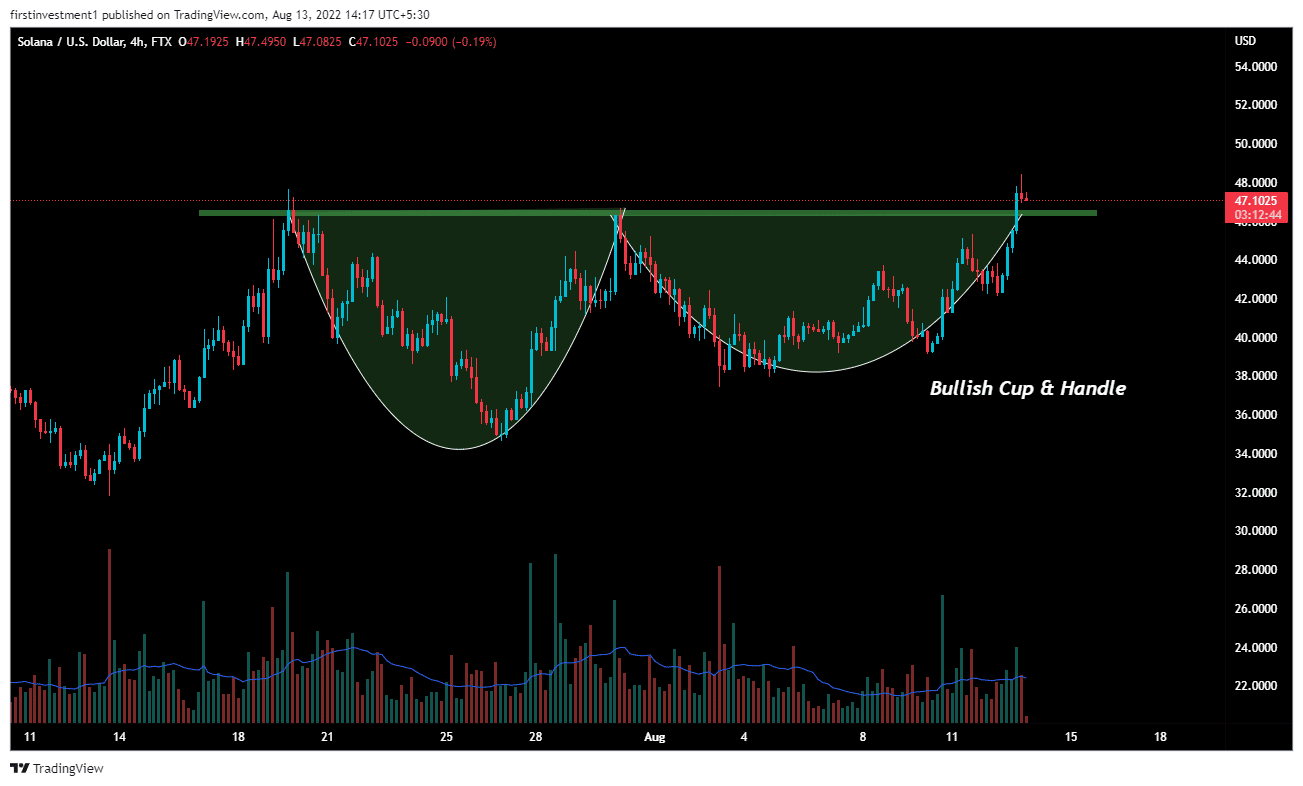
On the four-hour time frame, SOL gave a breakout of a Cup & Handle Pattern, which is a bullish continuation pattern along with good volumes.
But, there is not much consolidation near the neckline, which is $46.80. There is slightly a high chance of the price not being able to sustain above this line, which gave a false breakout.
Also read http://FTX Chief Sam Bankman-Fried Backs Solana (SOL) A Day After Major Exploit, Here’s Why
In order to achieve the bullish target, the price needs a daily close above $46.80.
On the flip side, a break below the $45.0 level could invalidate the bullish outlook. And the price can move below $38.0.
SOL is bullish on all time frames. Above $46.80 closing on the hourly time frame, we can put a trade on the buy side.
advertisement
As of publication time, SOL/USD is trading at $46.60 with more than 2% gains. According to CoinMarketCap, the 24-hour trading volume surged nearly 32% to $1,612,957,894. A rise in volume with the price is a bullish sign.
Share this article on:
The presented content may include the personal opinion of the author and is subject to market condition. Do your market research before investing in cryptocurrencies. The author or the publication does not hold any responsibility for your personal financial loss.