Published 20 mins ago
The Solana (SOL) price displays a bullish reversal opportunity with a double bottom pattern at the psychological Mark of $30. However, the declining 50-day EMA opposes the bullish growth to reach the neckline at $38. So, should you consider taking a bullish trade or wait until prices exceed $38?
advertisement
Key points From SOL Technical Analysis:
- The Solana price rose 10% in the last 48 hours.
- The daily-RSI slope spikes slightly above the halfway line reflecting.
- The 24-hour trading volume in the Solana coin is $1.04 Billion, indicating a 19% gain.

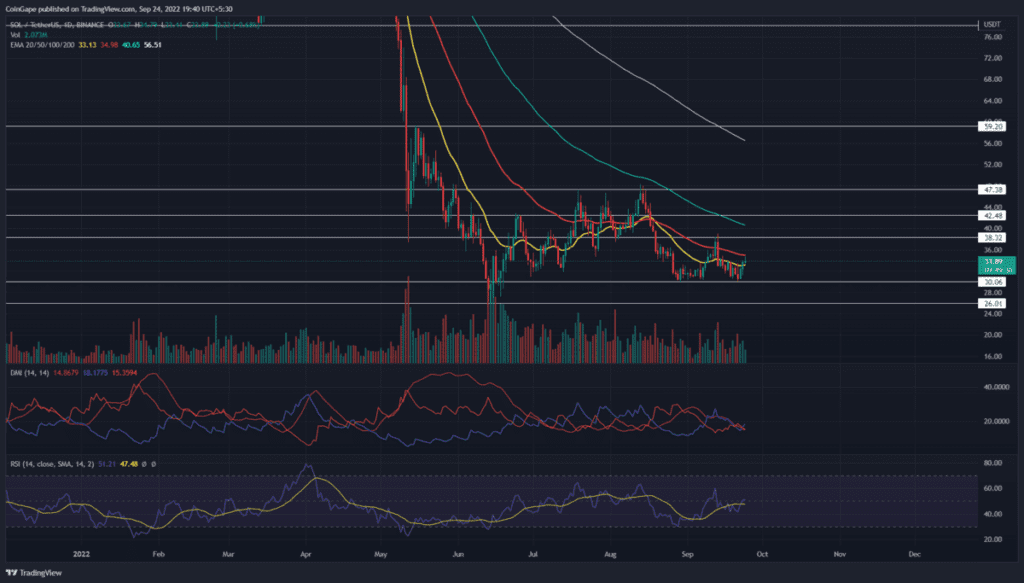
Source-Tradingview
During the last few bearish weeks, the SOL/USDT chart shows the Solana market price declined sharply to reach the bottom crucial support level at $30. The correction coincides with a reversal from the 100-day EMA accounting for a bear cycle of 20%, undermining the previous recovery rally seen in July.
Trending Stories
The bear cycle, however, fails to break the psychological Mark of $30, leaving a consolidation with the overhead resistance of $38. Additionally, the bullish resurfacing influence over the consolidation range teases a double bottom which generally forecasts a reversal from a notion formed at a solid base level.
The consolidation’s ceiling at $38 acts as the neckline of the bullish pattern and the recent reversal of 10% over the last two days cements the idea of a trend reversal. Hence, optimistic swing traders can find buying opportunities at the current market price.
However, the traders waiting for a breakout entry opportunity will have to be patient till the Solana market price surpasses the $38 neckline. The bullish pattern gives the next target as the $47 horizontal level.
However, considering the reversal rally fails to exceed the 50-day EMA, the double bottom theory will be nullified, potentially leading to a drop to $30.
Technical indicator
The rising RSI slope peaks above the halfway line supporting the bullish reversal theory by indicating a rise in the underlying bullishness. However, the sideways trend in the midterm reflects a bullish turmoil over the trend control.
advertisement
The declining trend in the crucial daily EMAs displays an overall downtrend, with the 50-day EMA providing resistance to the recovery rally.
- Resistance level- $38 and $47.2
- Support levels- $30 and $25
Share this article on:
The presented content may include the personal opinion of the author and is subject to market condition. Do your market research before investing in cryptocurrencies. The author or the publication does not hold any responsibility for your personal financial loss.