It is no news that the prices of major cryptocurrencies have hurtled in the past week or so, especially after Bitcoin slipped below its $50k mark. This drop-down in prices has caused the technicals to flash bearish signals at the time of writing. Polkadot moved southwards by 7%, BNB shed over 5%, and EOS also was in control of the bears as it was trading at 3.11% after depreciating by 3% in the last 24 hours.
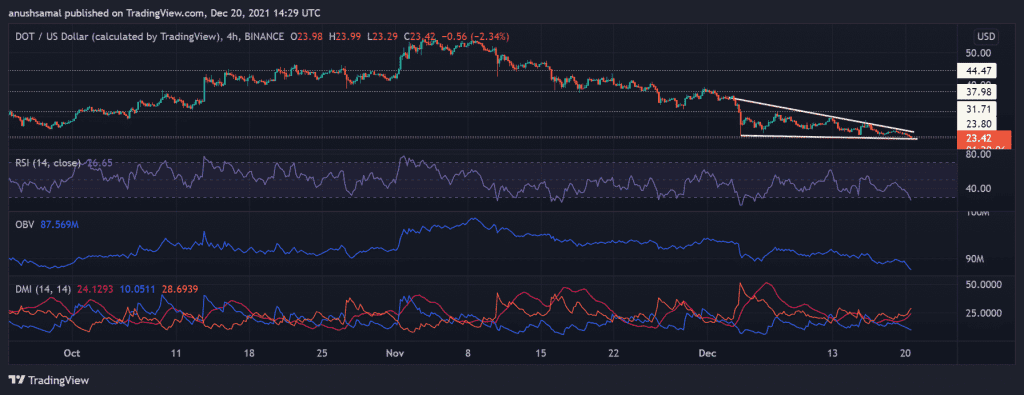
Polkadot/USD Four Hour Chart

Polkadot’s market price has declined from November, and the coin had managed to stay put above the long-standing support mark of $23. At press time, the coin price was $23.42, falling beneath which it would invalidate its four-month long price floor and trade near $19.
DOT’s drop in prices has formed a descending triangle in the last week and a half, hinting that the bears have become stronger.
The cryptocurrency aggressive decline can also be tied to increased selling pressure. The Relative Strength Index was in the negative zone as the asset was oversold owing to the high fear index. On Balance, Volume has also affirmed the above reading is indicating a mundane buying strength. The Directional Movement Index displayed bearish robustness as the -DI was above the +DI line.
BNB/USD Four Hour Chart

Binance Coin was seen trading below the 20-SMA line, which signaled that sellers had driven the price momentum in the market. At press time, the coin was valued at $506.9 after it noted a pullback at $581.4 and then at $528.5, respectively.
By reading the technicals, a price reversal over the upcoming trading sessions looks bleak.
Over a week now, BNB’s price action has been mundane as the coin stood at the same price. The immediate resistance mark for the coin was at $528.5, while the support rested at $474.6.
The Relative Strength Index was parked in the oversold zone as the asset was immensely undervalued at press time. Awesome Oscillator saw emerging red histograms, which signified a downtrend in prices.
EOS/USD Four-Hour Chart

EOS struggled to move past the 23.6% Fibonacci level since the beginning of December, and that level has been acting as the immediate resistance level.
The further downtrend will cause EOS to fall below its $2.93 price floor, which the coin hasn’t fallen since January 2021. EOS last lost over 6% in the last week after it tried to topple over its overhead resistance of $3.28.
In case prices recover, there are strong chances that the bulls might get rejected at the 23.6% Fibonacci level and subsequently at the 38.2% level too. The technical outlook was skewed towards the bear of the market.
The Relative Strength Index had dipped below the half-line as selling pressure took over due to bearish price action. The Directional Movement Index was inclined towards the bears. Awesome Oscillator had also gravitated towards the bears in the market.