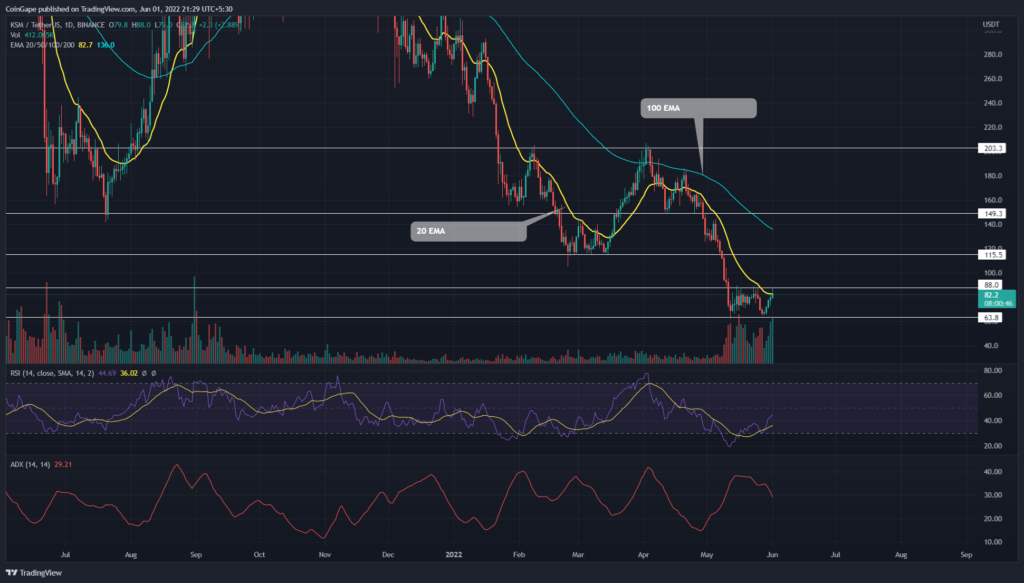
Responding to the ongoing uncertainty in the crypto market, the Kusama(KSM) price has been resonating within the $88 and $63.8 levels for the past three weeks. However, a possible breakout from this range should end the wavering consolidation and trigger a directional move.
advertisement
Key points:
- The KSM price faced significant resistance from 20-day EMA
- The KCS chart shows a shooting star candle at $88 resistance
- The intraday trading volume in the KSM is $192.6 Million, indicating a 65% gain
Source- Tradingview
On April 2nd, the KSM buyers’ failed attempt to surpass the $205 resistance triggered a minor correction. Therefore, the falling price sank 34% lower and hit the March bottom support of $115.
However, the May 2022 sell-off in the crypto market bolstered KSM sellers to breach the $115 support. On May 8th, this support fallout extended the ongoing correction and tumbled the altcoin by another 20% to a low of $63.8.
Trending Stories
Furthermore, the coin buyers have been struggling to breach the immediate resistance of $88 for the past three weeks resulting in a minor consolidation. Today, the KSM price presents its third retest to the overhead resistance, but a high wick rejection attached to the daily candle suggests another reversal.
Thus, a bearish reversal could plunge the KSM price 16% lower to $63.8 support and continue a range rally for a few more sessions,
On a contrary note, a possible breakout from the $88 resistance would drive the altcoin to the $115 mark.
Concluding, the interested traders should wait for range breakout for better confirmation of their trade.
Technical indicator
ADX- The falling trend in the ADX slope continues as the bullish reversal awaits the price confirmation with the $88 breakout. Traders can expect an increase in trend momentum after the bullish breakout.
advertisement
RSI- A bullish divergence after the reversal from the oversold region in the daily-RSI chart supports the $88 bullish breakout theory.
- Resistance levels- $88, and $115
- Support levels- $63.8 and $47.5


